Organization and user management
Setting up your organization
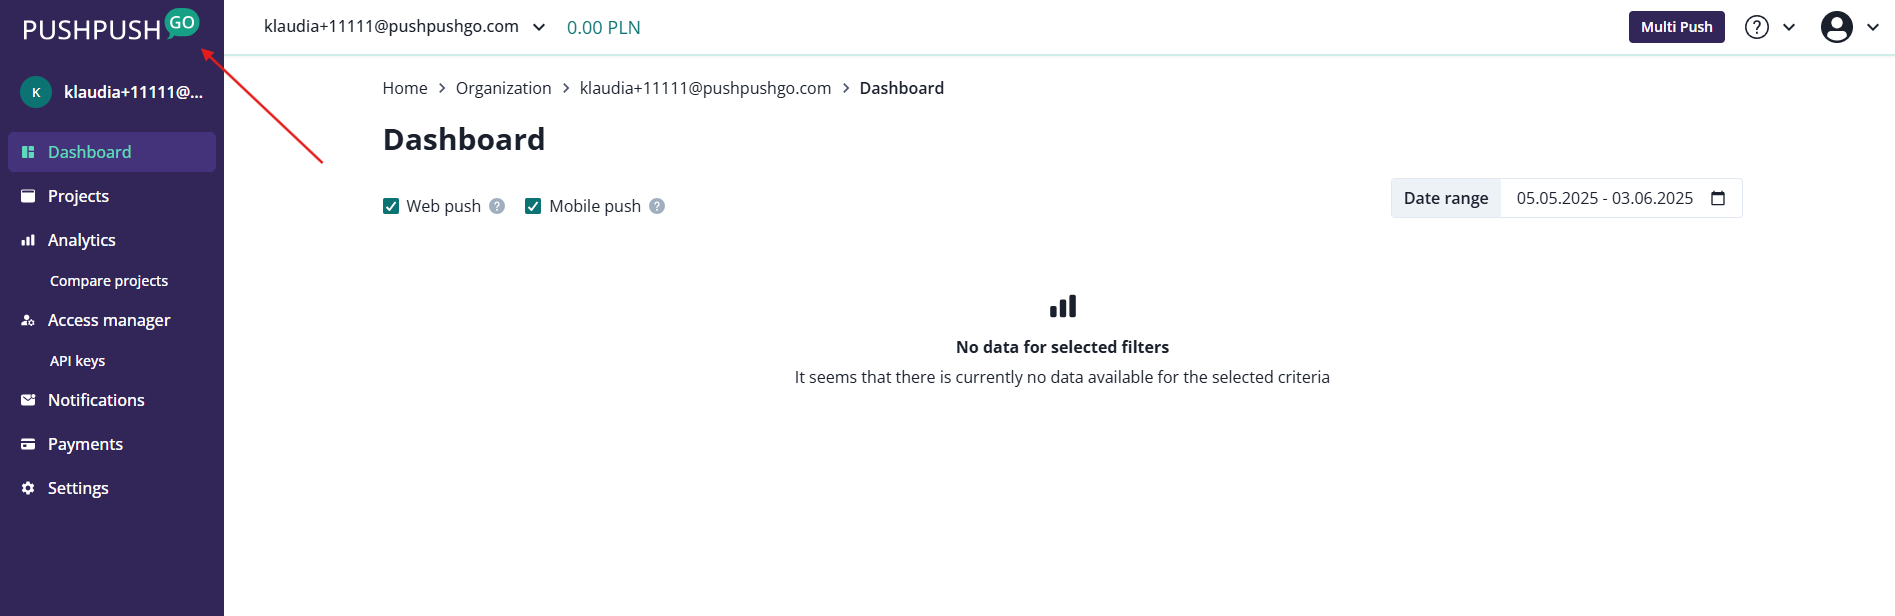
Your first organization is automatically created when you create an account. To access your organization from every place of the PushPushGo application, click on the PushPushGo logo in the upper left corner:
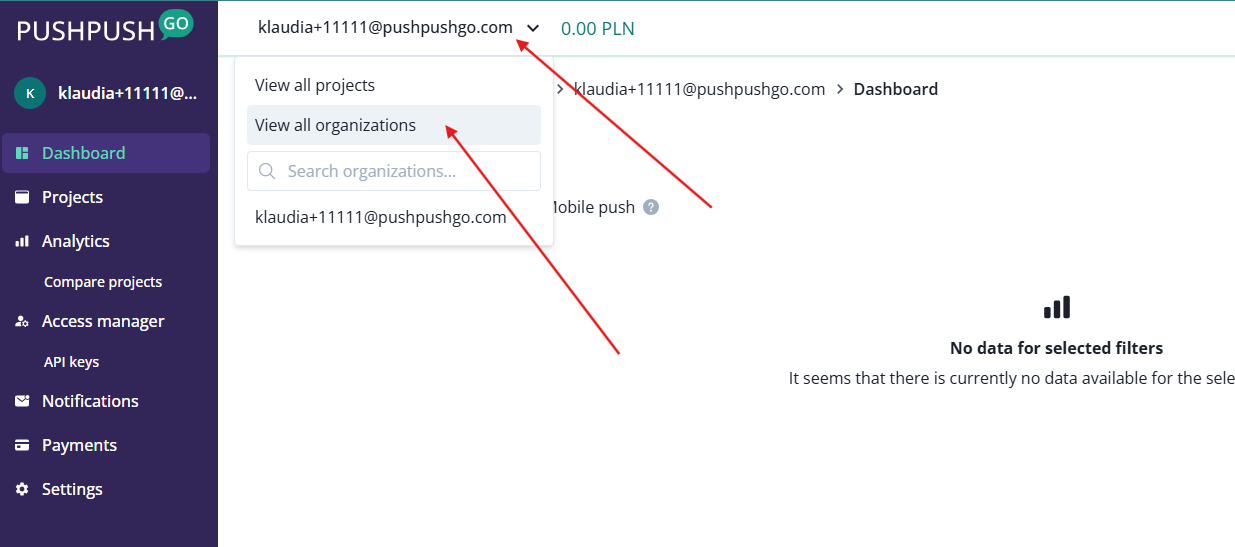
You can also use the drop-down menu:
Either of these option will get you to the https://next.pushpushgo.com/projects page from which you can go to organizations:
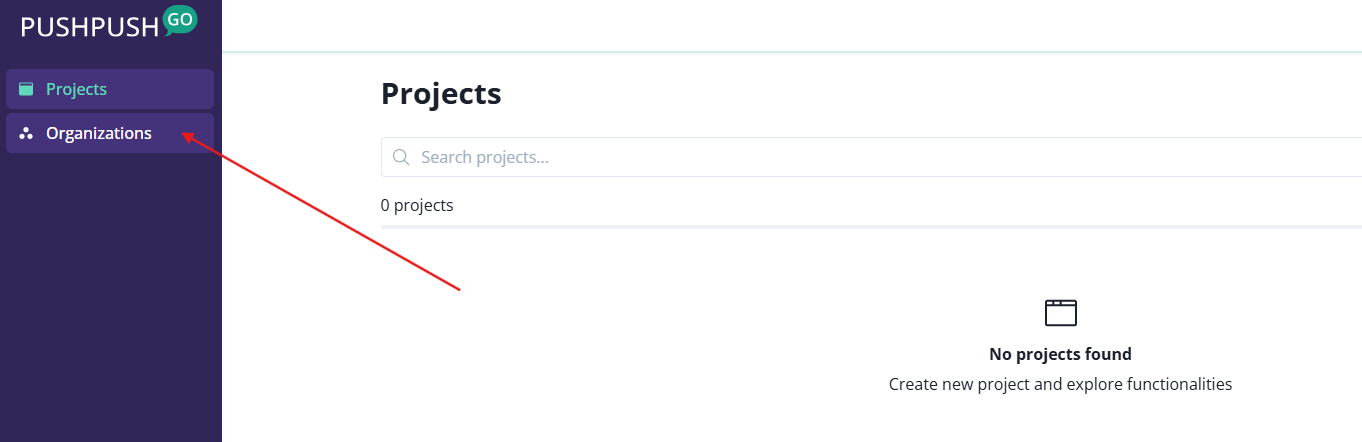
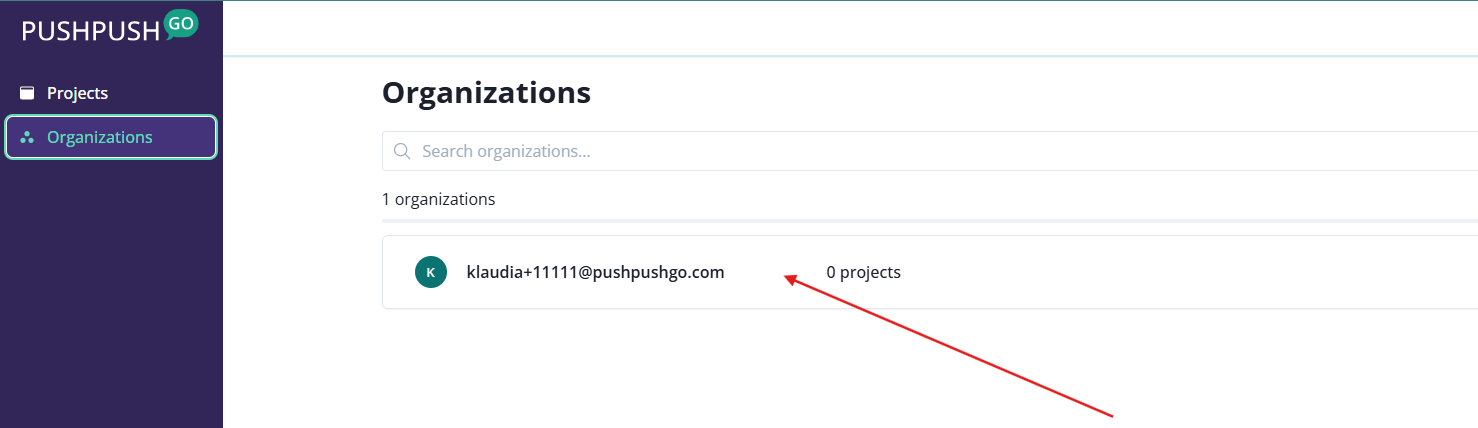
Now, click on the organization you want to edit:
Edit organization settings
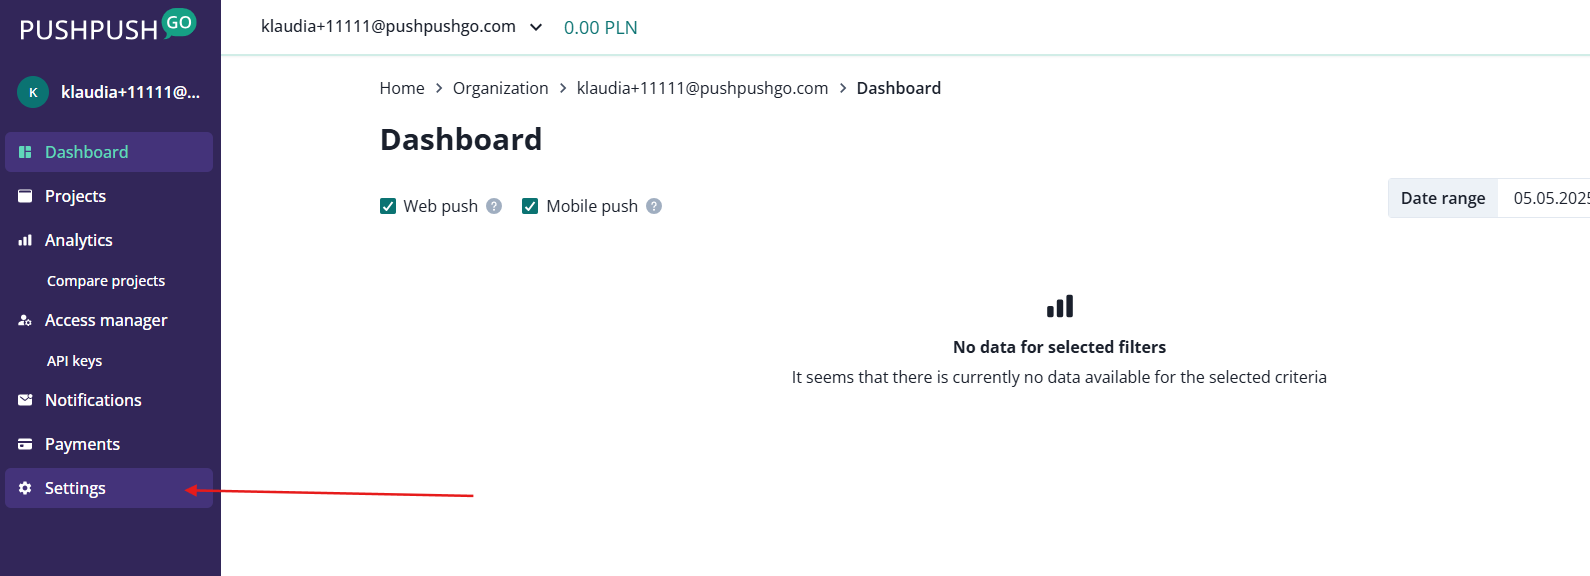
Go to the organization settings:
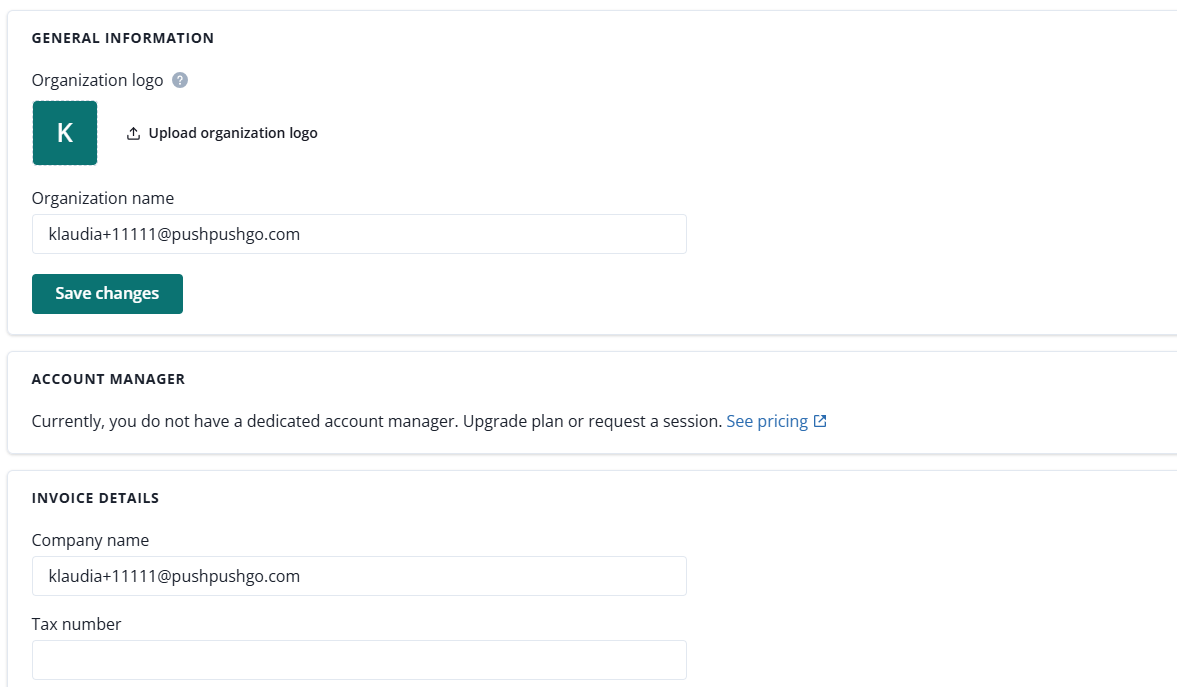
Here you will find:
- General organization information like logo and name,
- Account manager name and email (if you are an enterprise client),
- Invoice details,
- Limits (linked to your plan, e.g. number of segments you can have).
Access manager
Roles that are available in Access manager are as follows:
- Organization manager (all actions within organization, including access manager, subscription management and invoicing),
- Project manager (all contexts withing the project, including project and integration settings)
- Project editor (configuring and sending campaigns, analytics, campaigns' reports).
- Project viewer (only viewing project).
Only organization manager (there can be more than one) can invite or remove team members in the organization. Every user invitied to an organization must create and activate an account. The invitation will be sent on the email address of the joining team member.
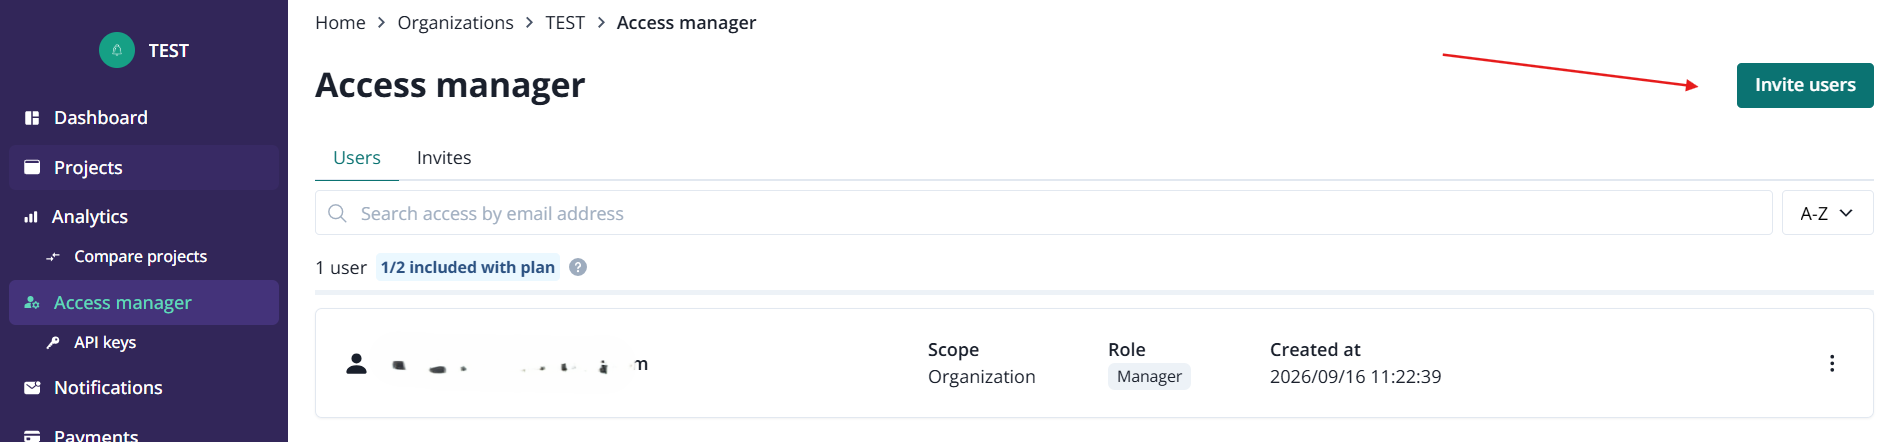
To invite a new team meber, go to Organization > Access manager and click on "Invite user".
Now, fill in the email address of the joining team member and select the scope: organization or project. Withing organization you only got one option: organization manager.
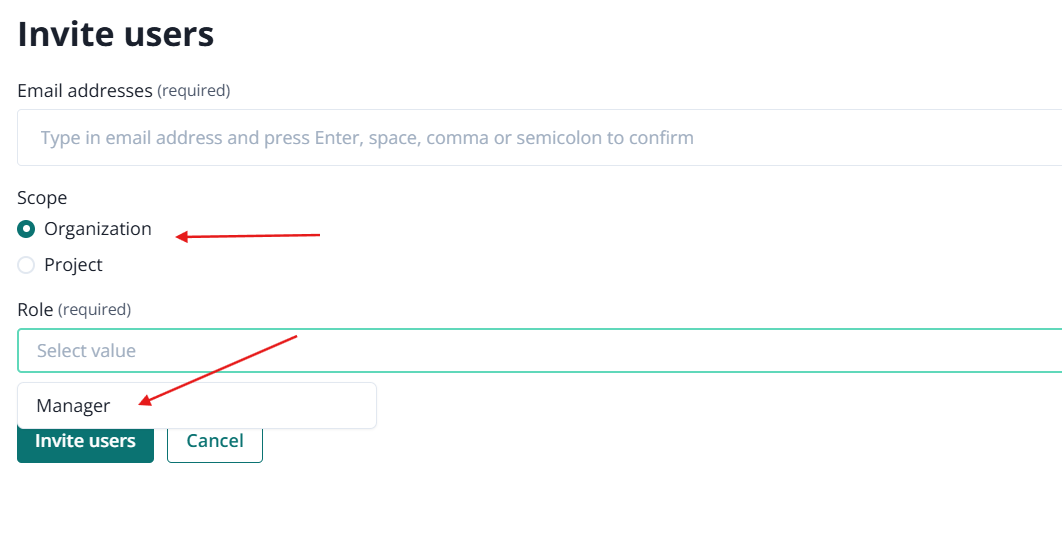
If you are inviting a new memeber to the project scope, you can choose between: project manager, editior or viewer.
You can invite mutliple users at the same moment.
To confirm your action, hit "Invite users".
API keys
API keys can be created and managed after accessing that option from the organization navigation bar.
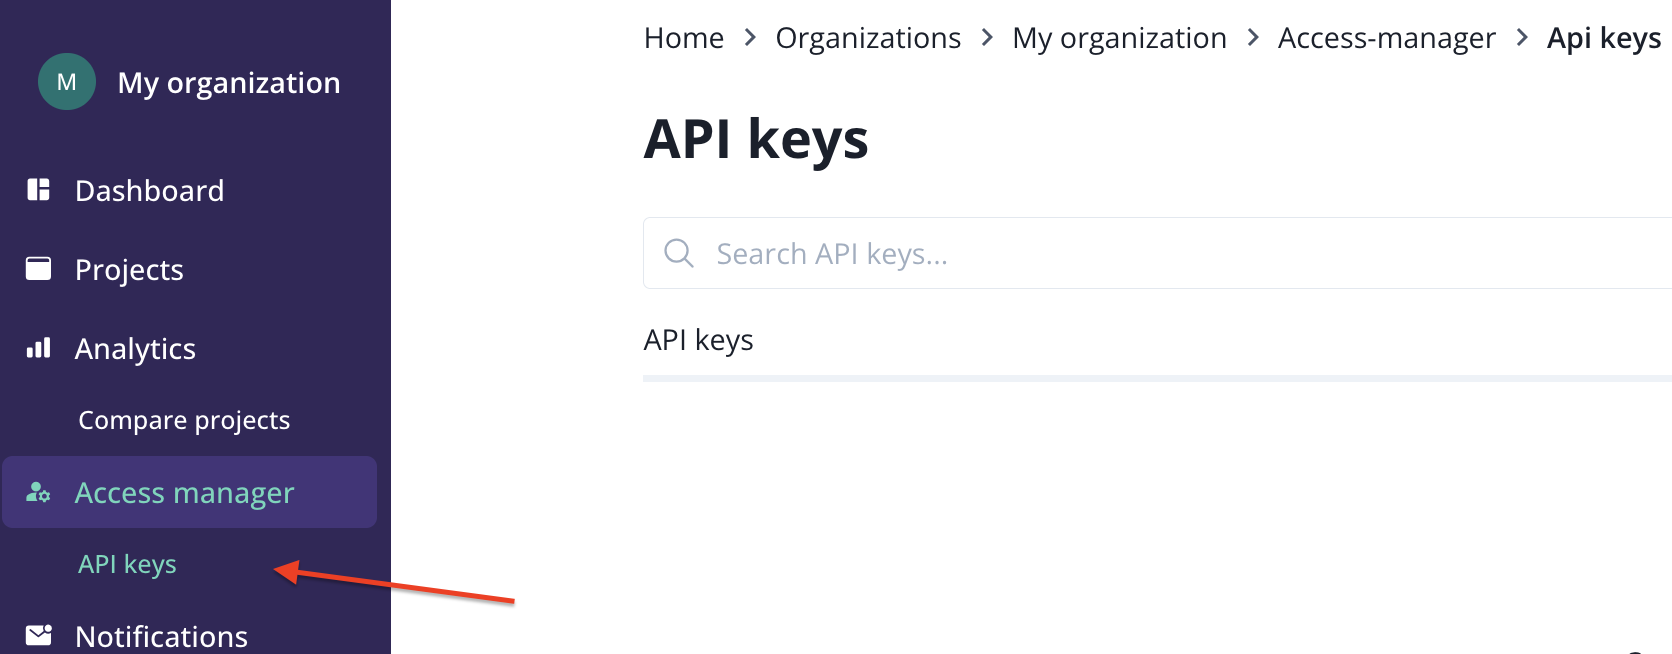
To generate a new API Key hit New API Key button.

Now, fill in the required information:
- name,
- projects,
- expire date.
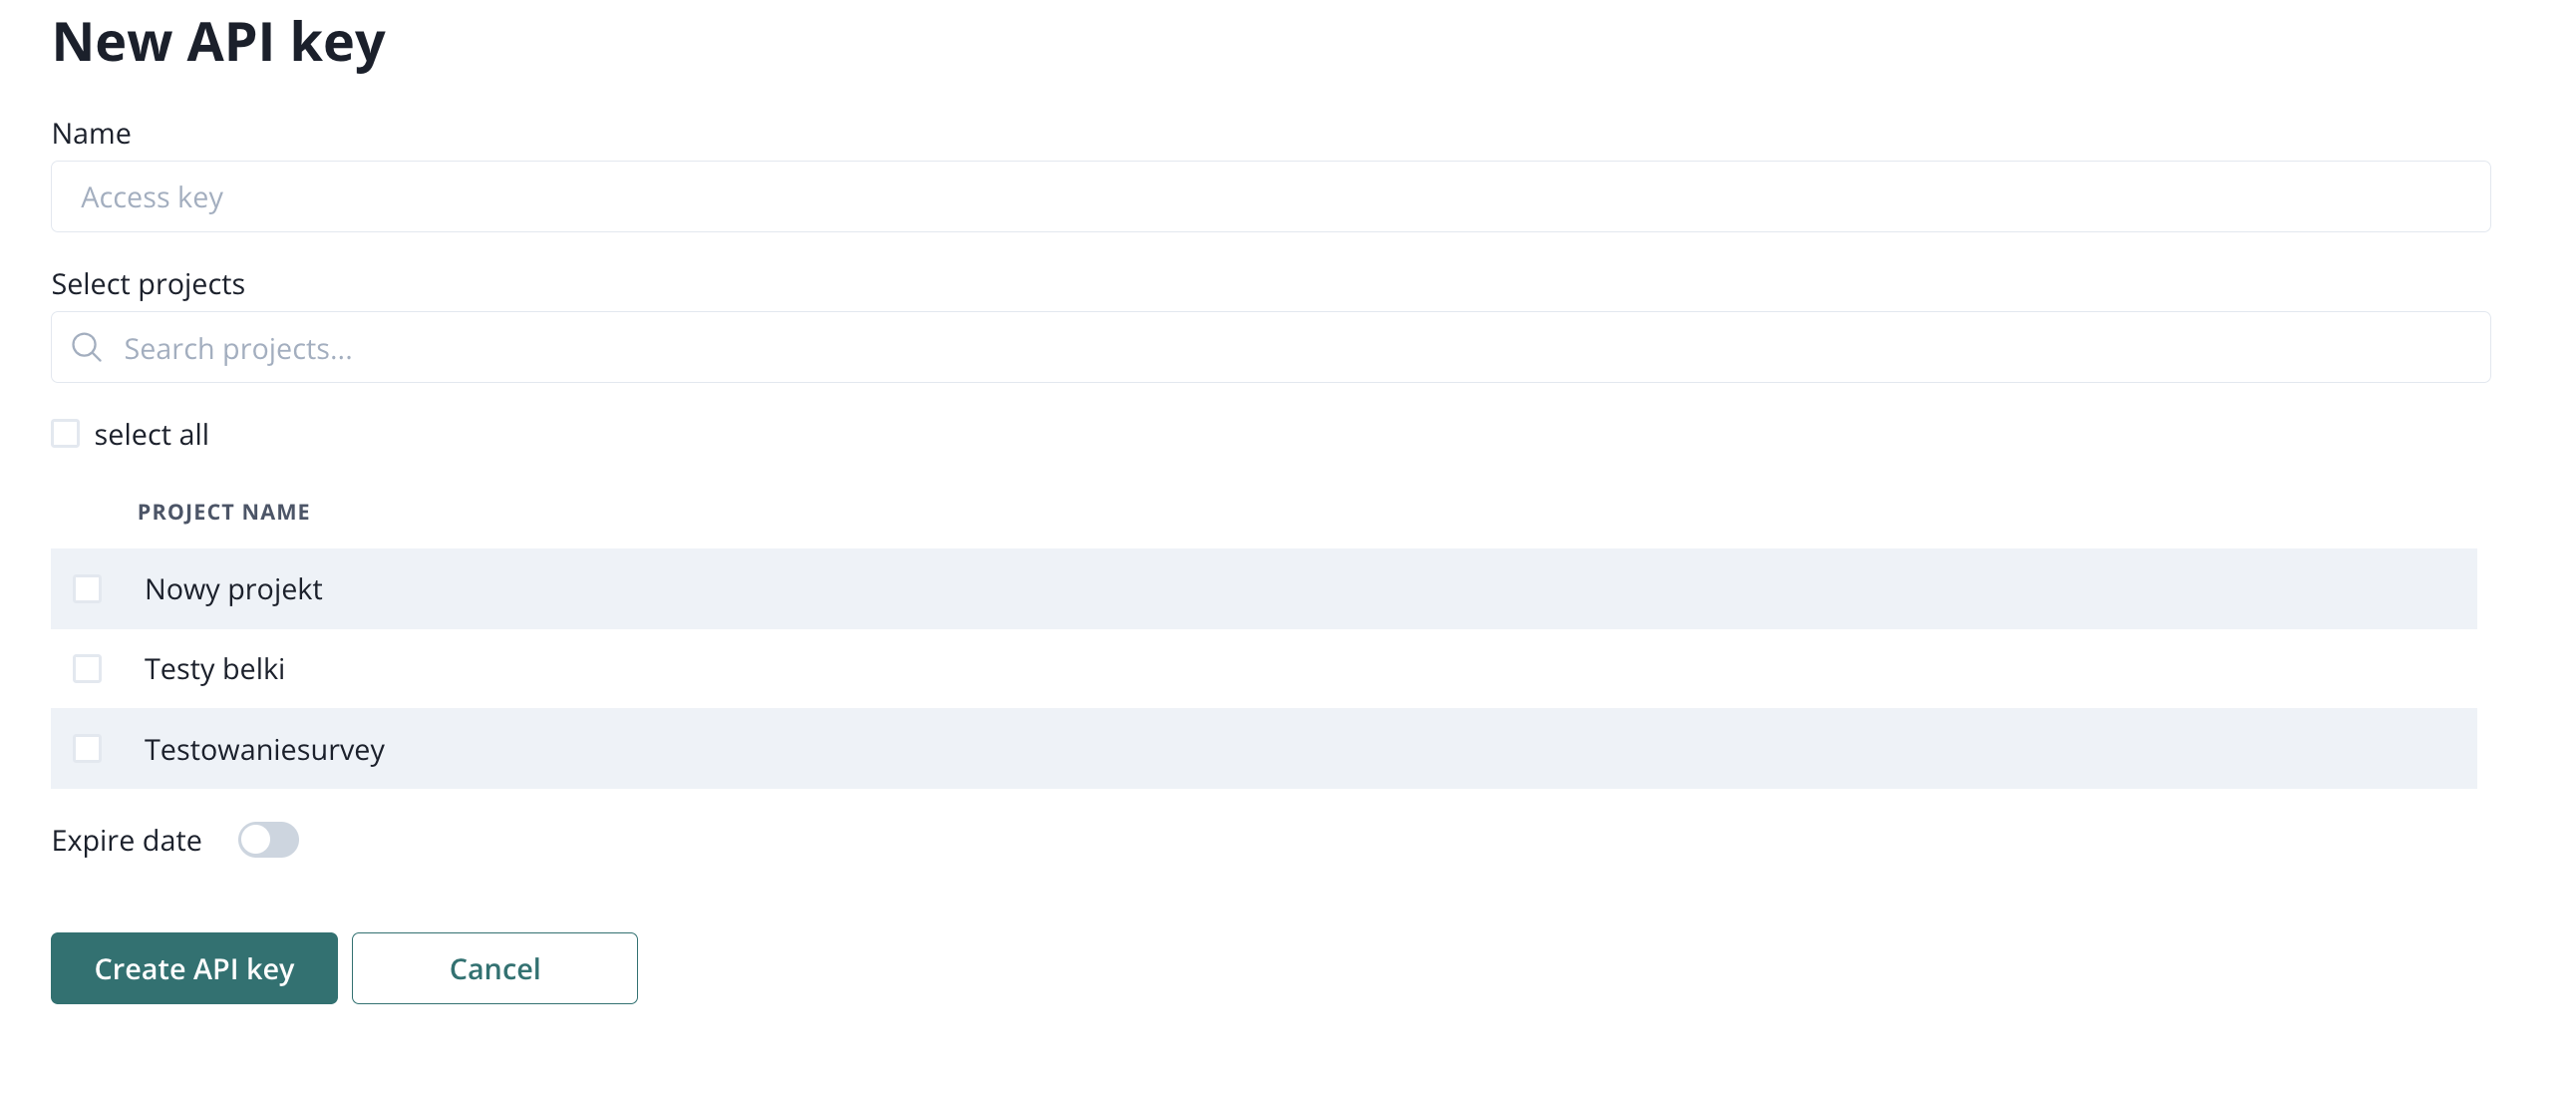
Once you are done, hit Create API Key button. Your API key is ready and you can use it in your API implementations.
User roles and permissions
Roles available in PushPushGo are as follows:
- Organization manager (all actions within organization, including access manager, subscription management and invoicing),
- Project manager (all contexts withing the project, including project and integration settings)
- Project editor (configuring and sending campaigns, analytics, campaigns' reports).
- Project viewer (only viewing project).
Organization owner can be changed in the system by contacting us on support@pushpushgo.com. If you are about to delete your account while currently holding the account owner role, the system will ask you to transfer that role to a chosen team member, before your account is removed from our system.
Notifications
To edit your notification preferences, you must first select that option from the organization navigation bar.
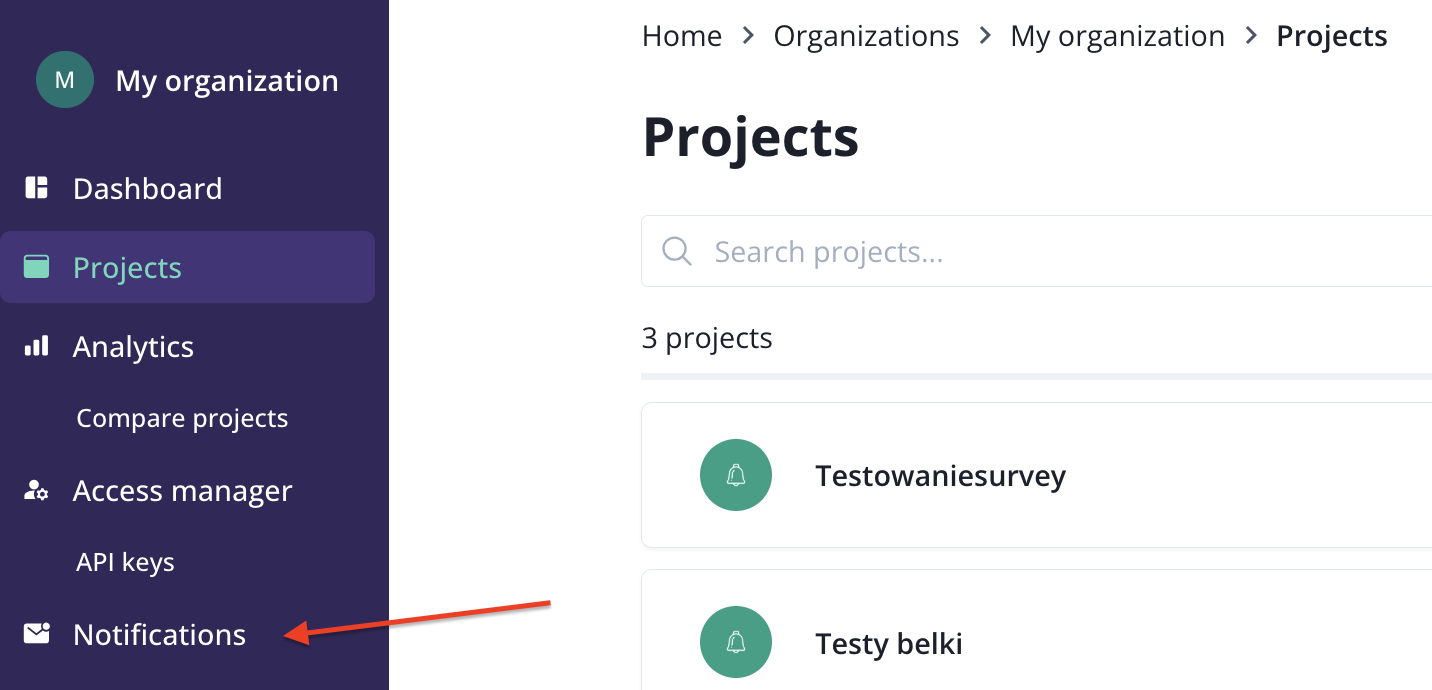
There are two sections in Notifications: Email log and Channels.
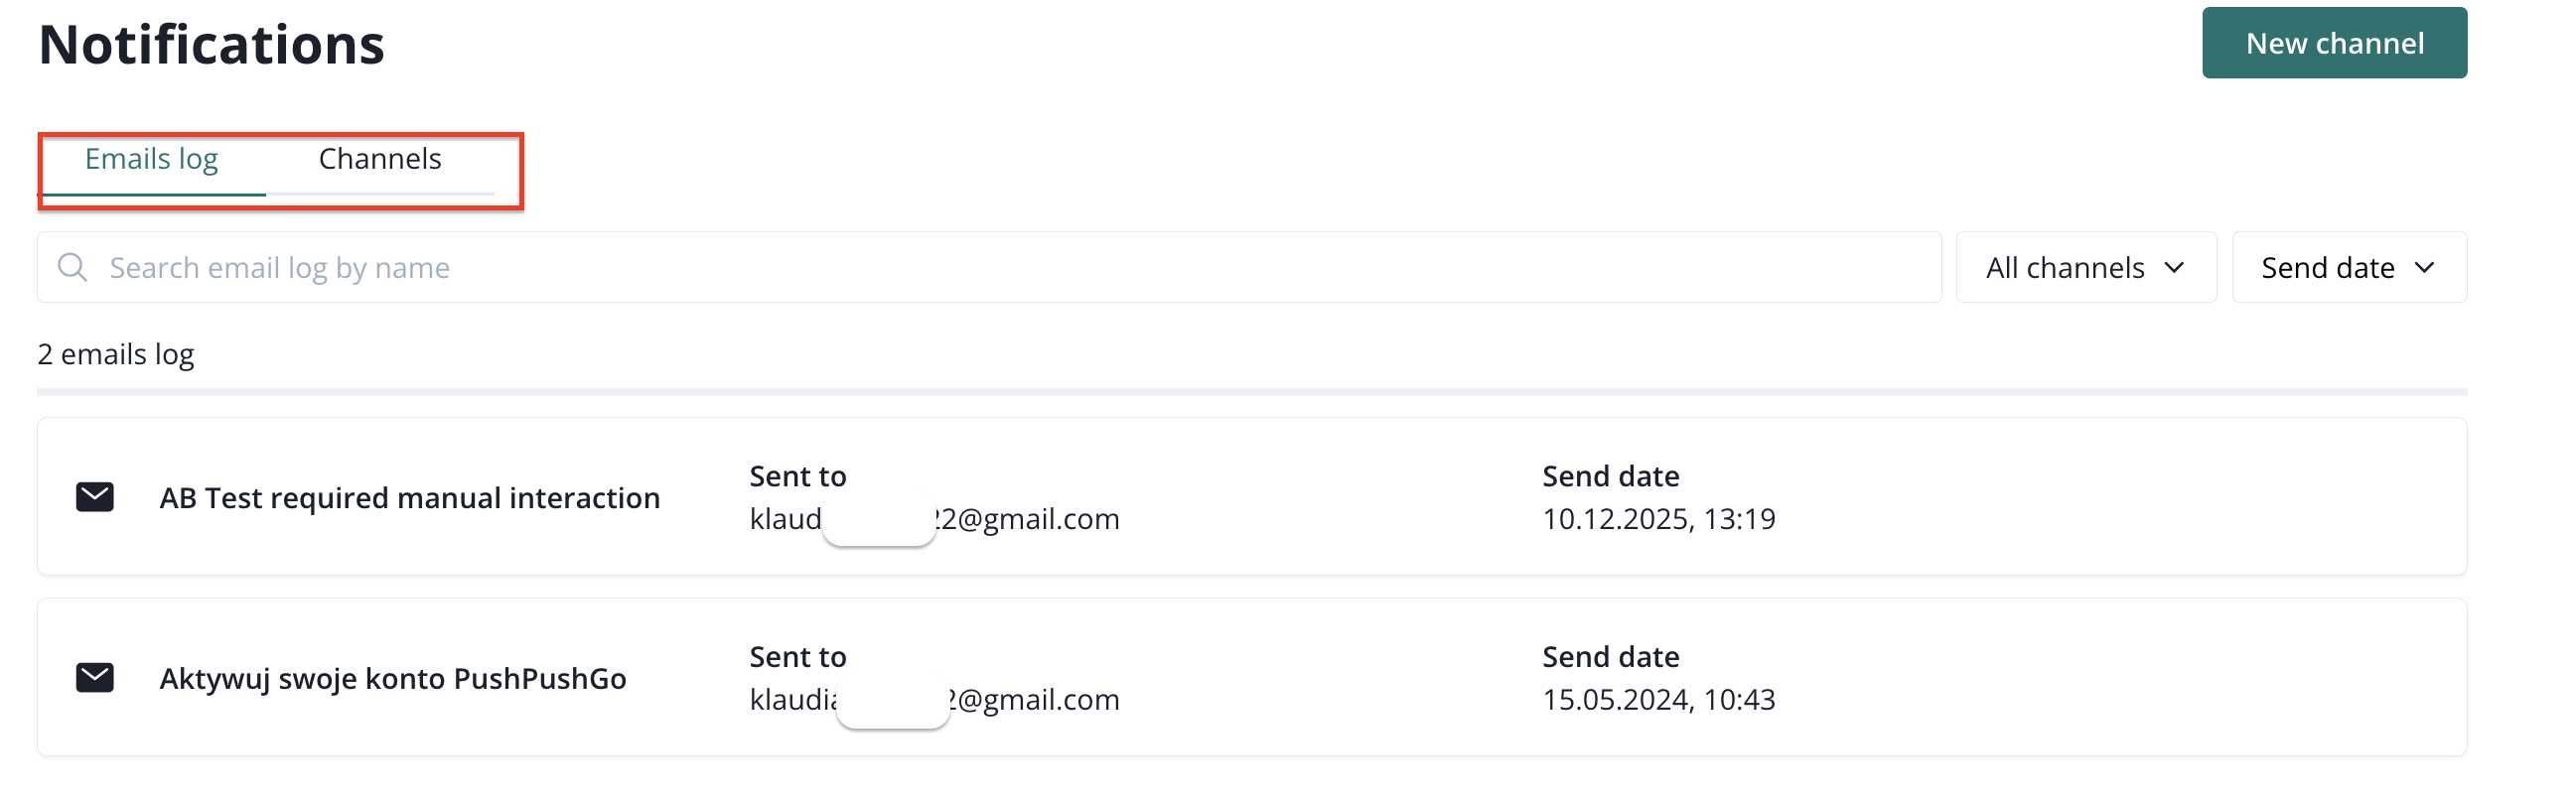
Email log will show you the history of all emails that we sent to particular users. By default, we communicate with the organization owner, however you can decide which user receives chosen information by defining Channels.
Here is a default channel defined for the organization owner.
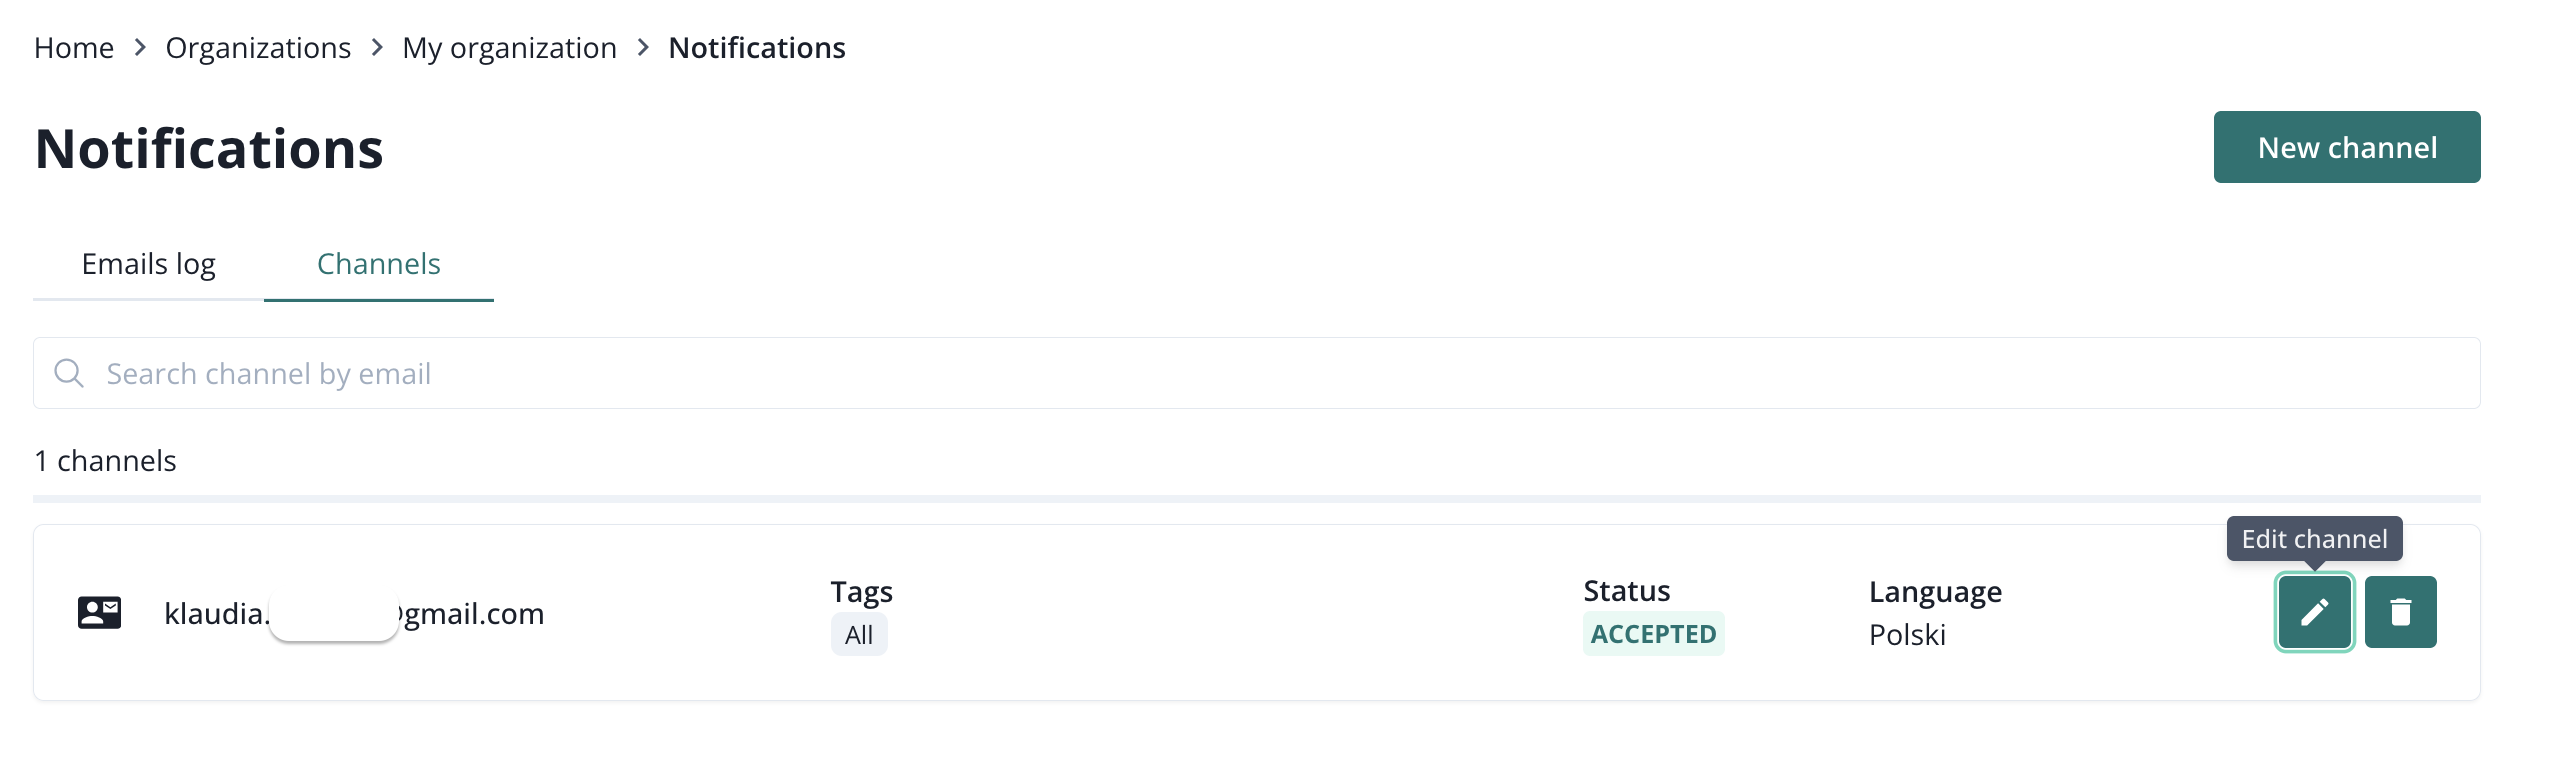
After clicking on Edit option, we can make changes in preferences.
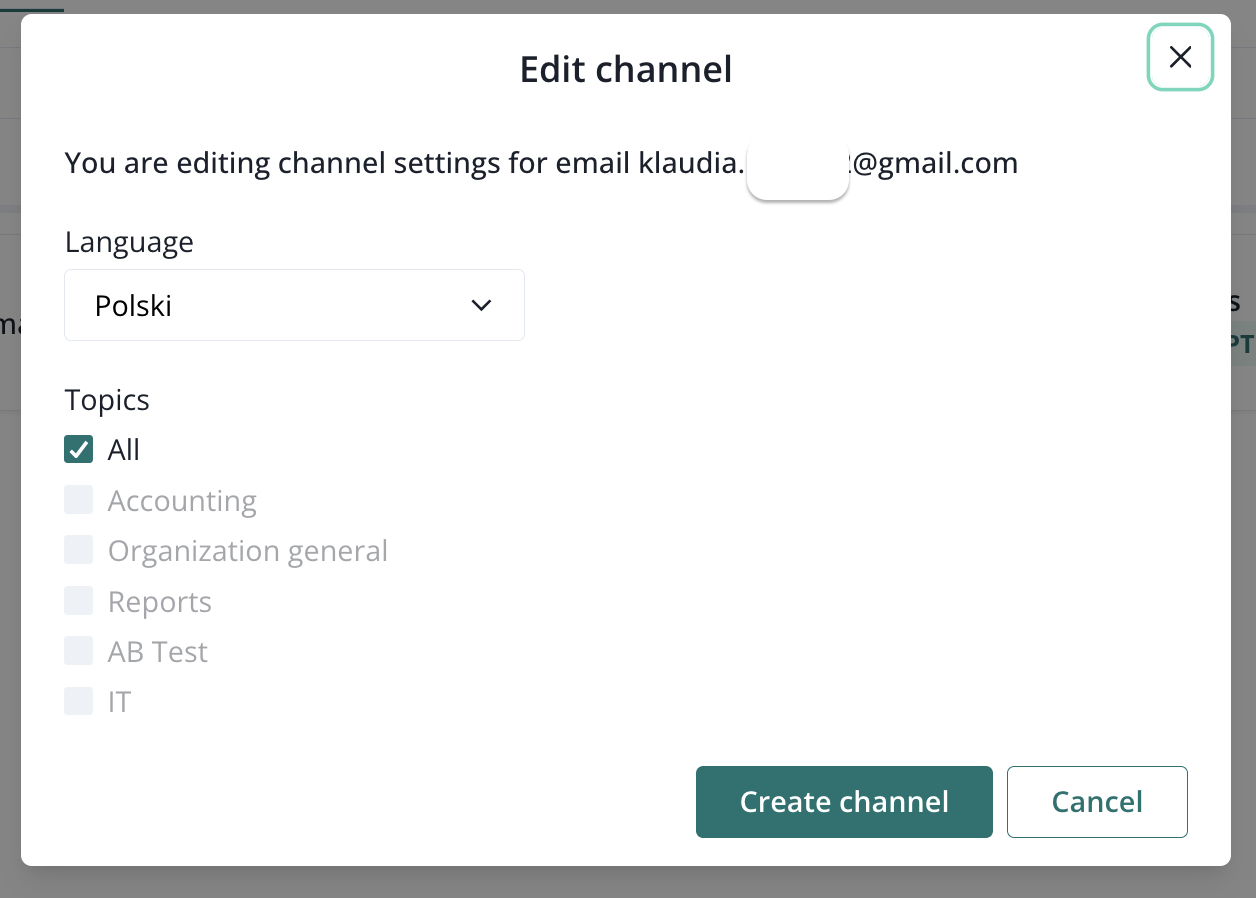
You can create as many channels as you need; e.g. for each organization member.
Organization dashboard
When you access your organization view, the first thing that you will see is your organization Dashboard. Here you can find general numbers regarding your organization.
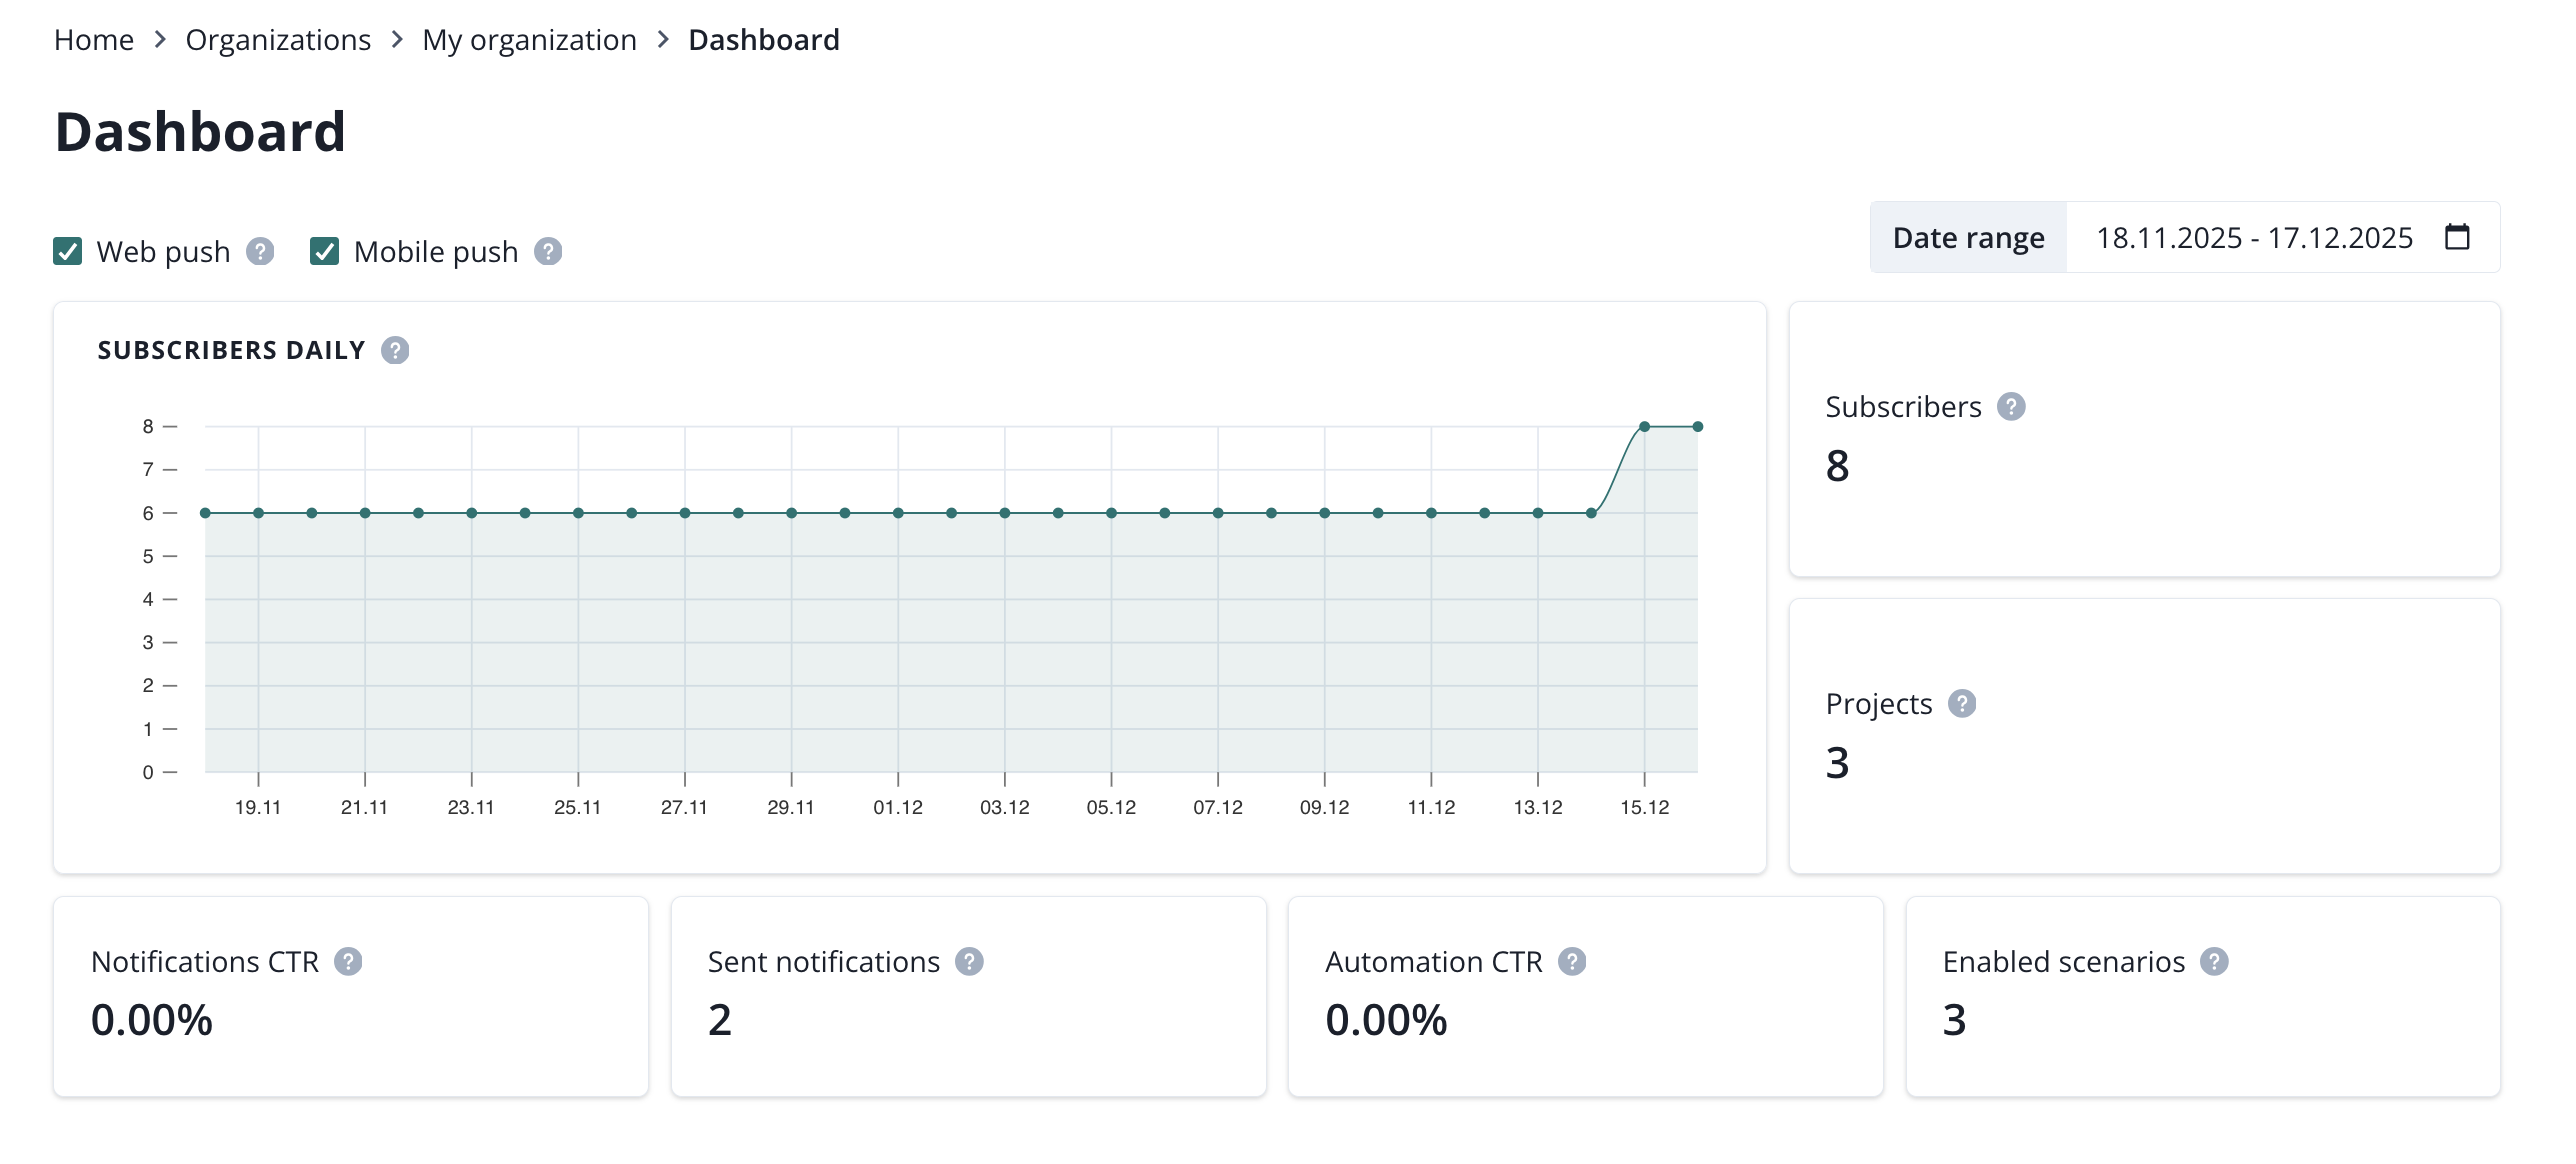
In the filtering options there is a date range, which helps narrowing down your numbers to a specific time period. Numbers that can be filtered by the date range include:
- Subscribers,
- Projects,
- Notification CTR (web push, mobile push),
- Sent notifications (web push, mobile push),
- Automation CTR (web push, mobile push),
- Enabled scenarios.
Organization analytics
In organization analytics you will find three pages.
- Subscribers,
- Push notifications,
- Automations.
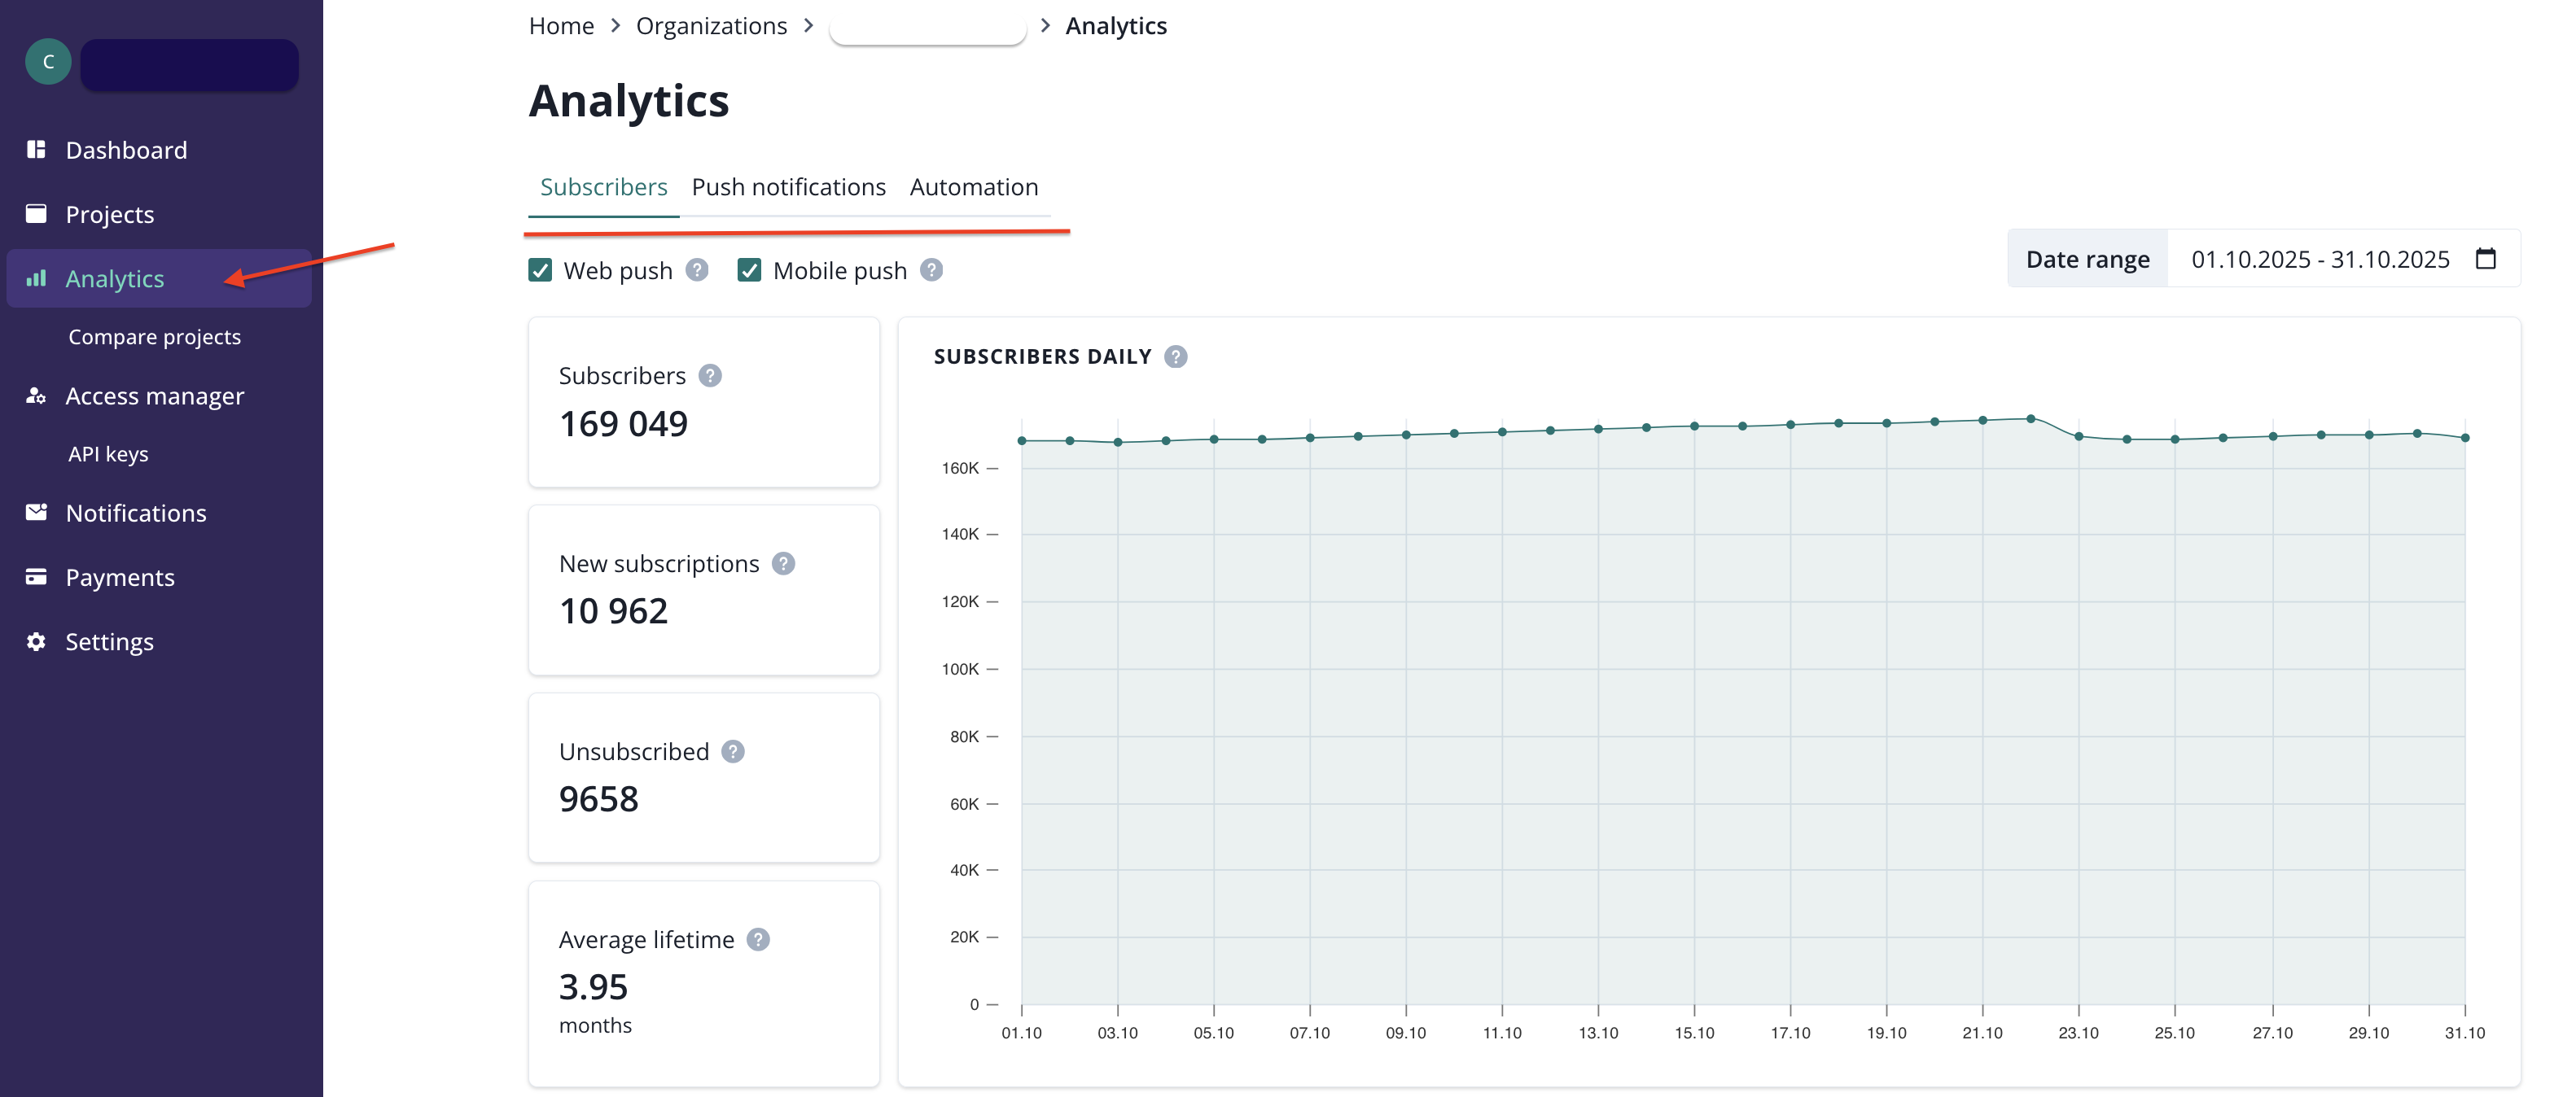
These refere to the push notifications numbers in your organization.
Subscribers
In the first section of the Subscribers page, you can see a chart showing how your push subscriber base is growing (or shrinking, if the trend shows more unsubscriptions than new subscriptions) across the entire organization. There are also a few crucial metrics displayed.
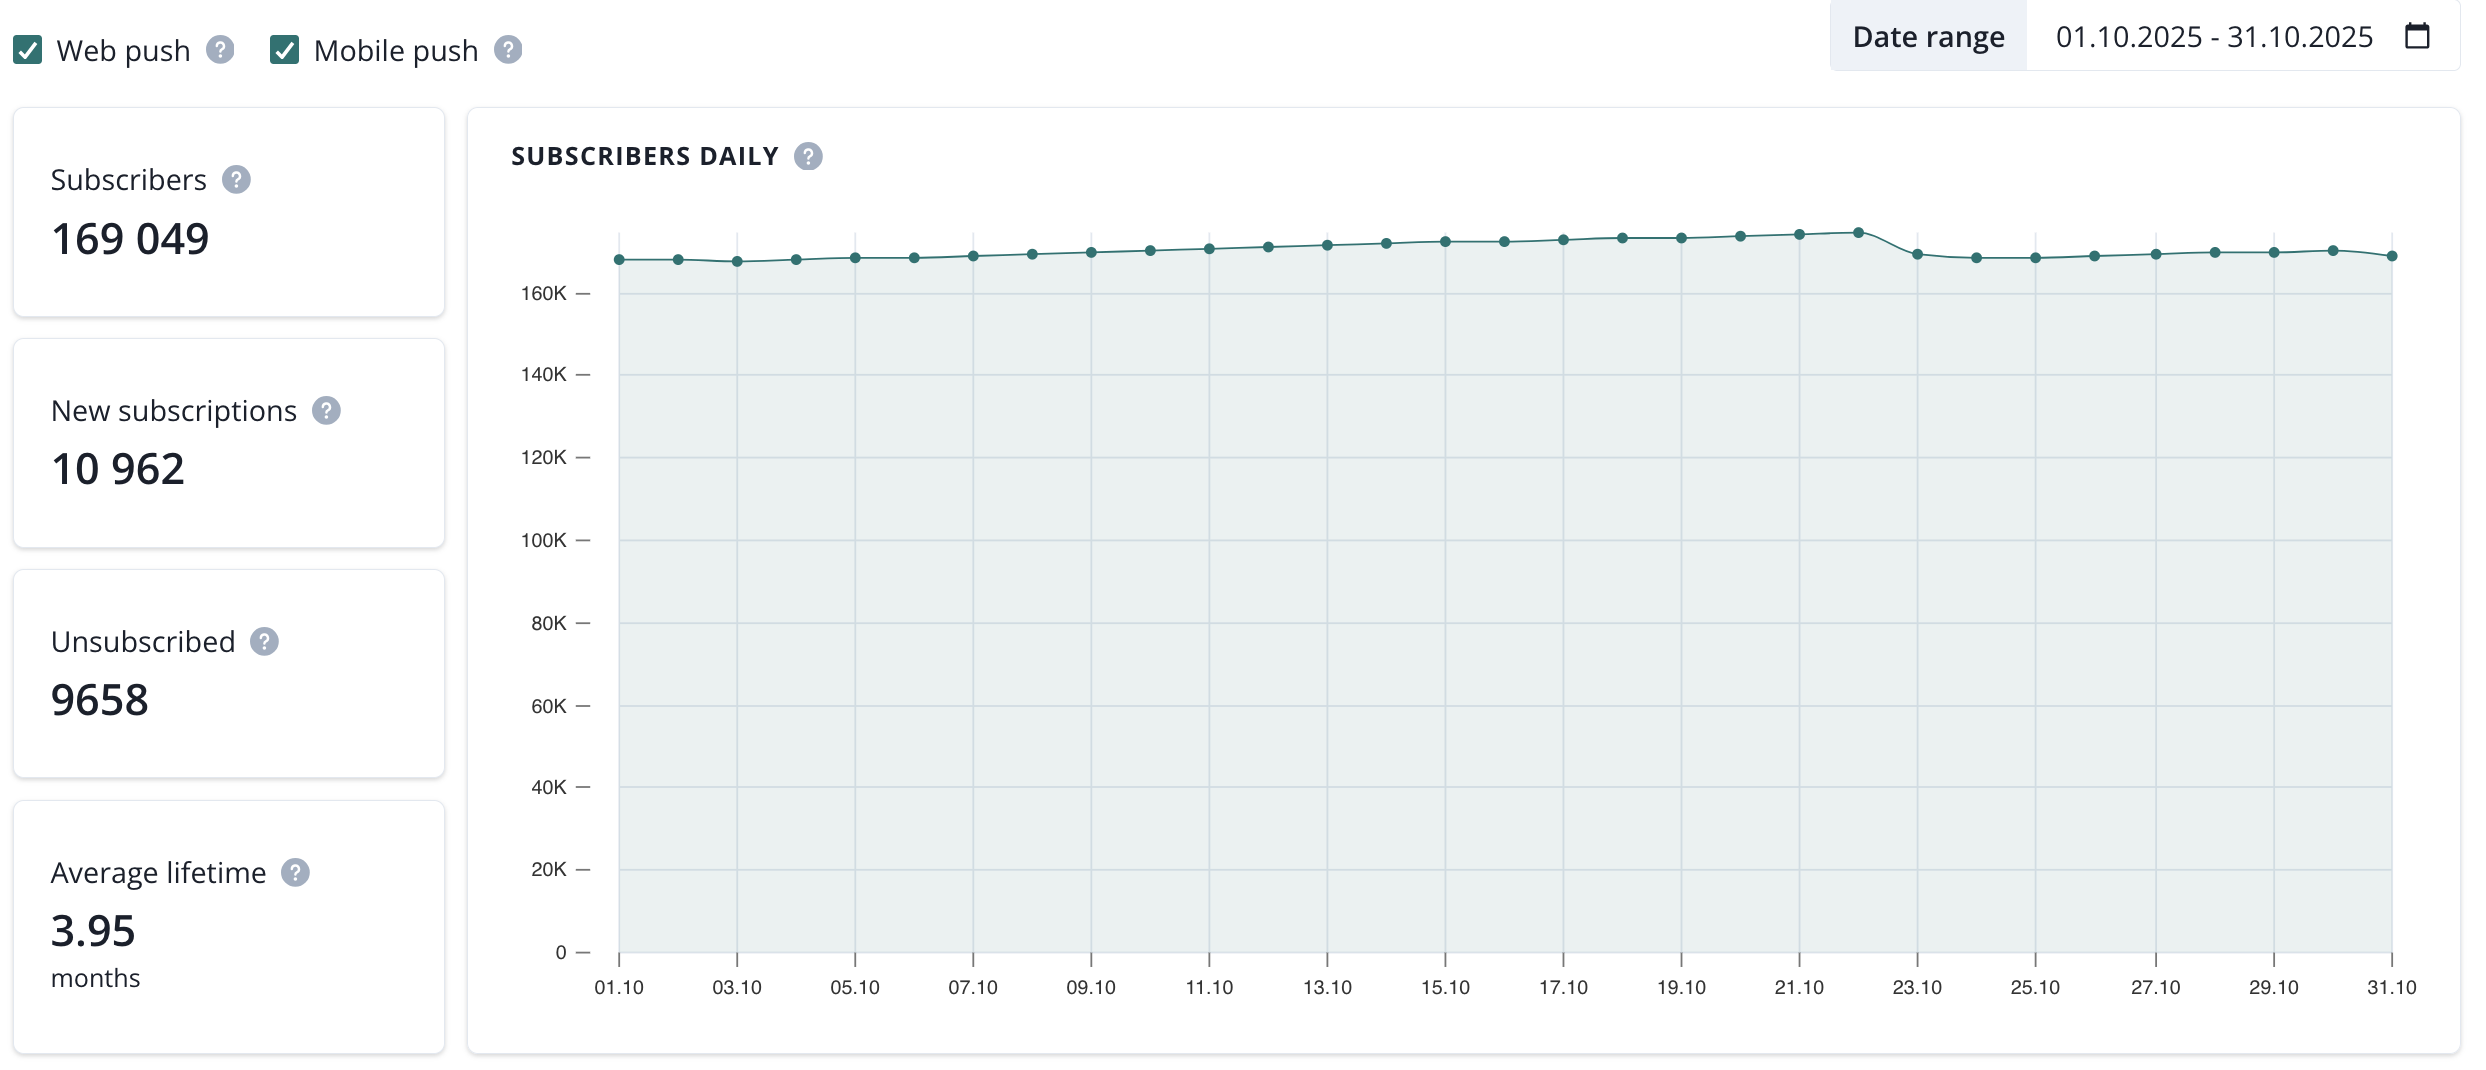
- Subscribers (total number of subscribers in the last day of selected date range)
- New subscriptions (total number of all new subscriptions in the selected date range)
- Unsubscribed (total number of all unsubscriptions in the selected date range)
- Average lifetime (average lifetime of a subscriber in the selected date range)
These numbers can be filtered by the date range and platform type: web/mobile push.

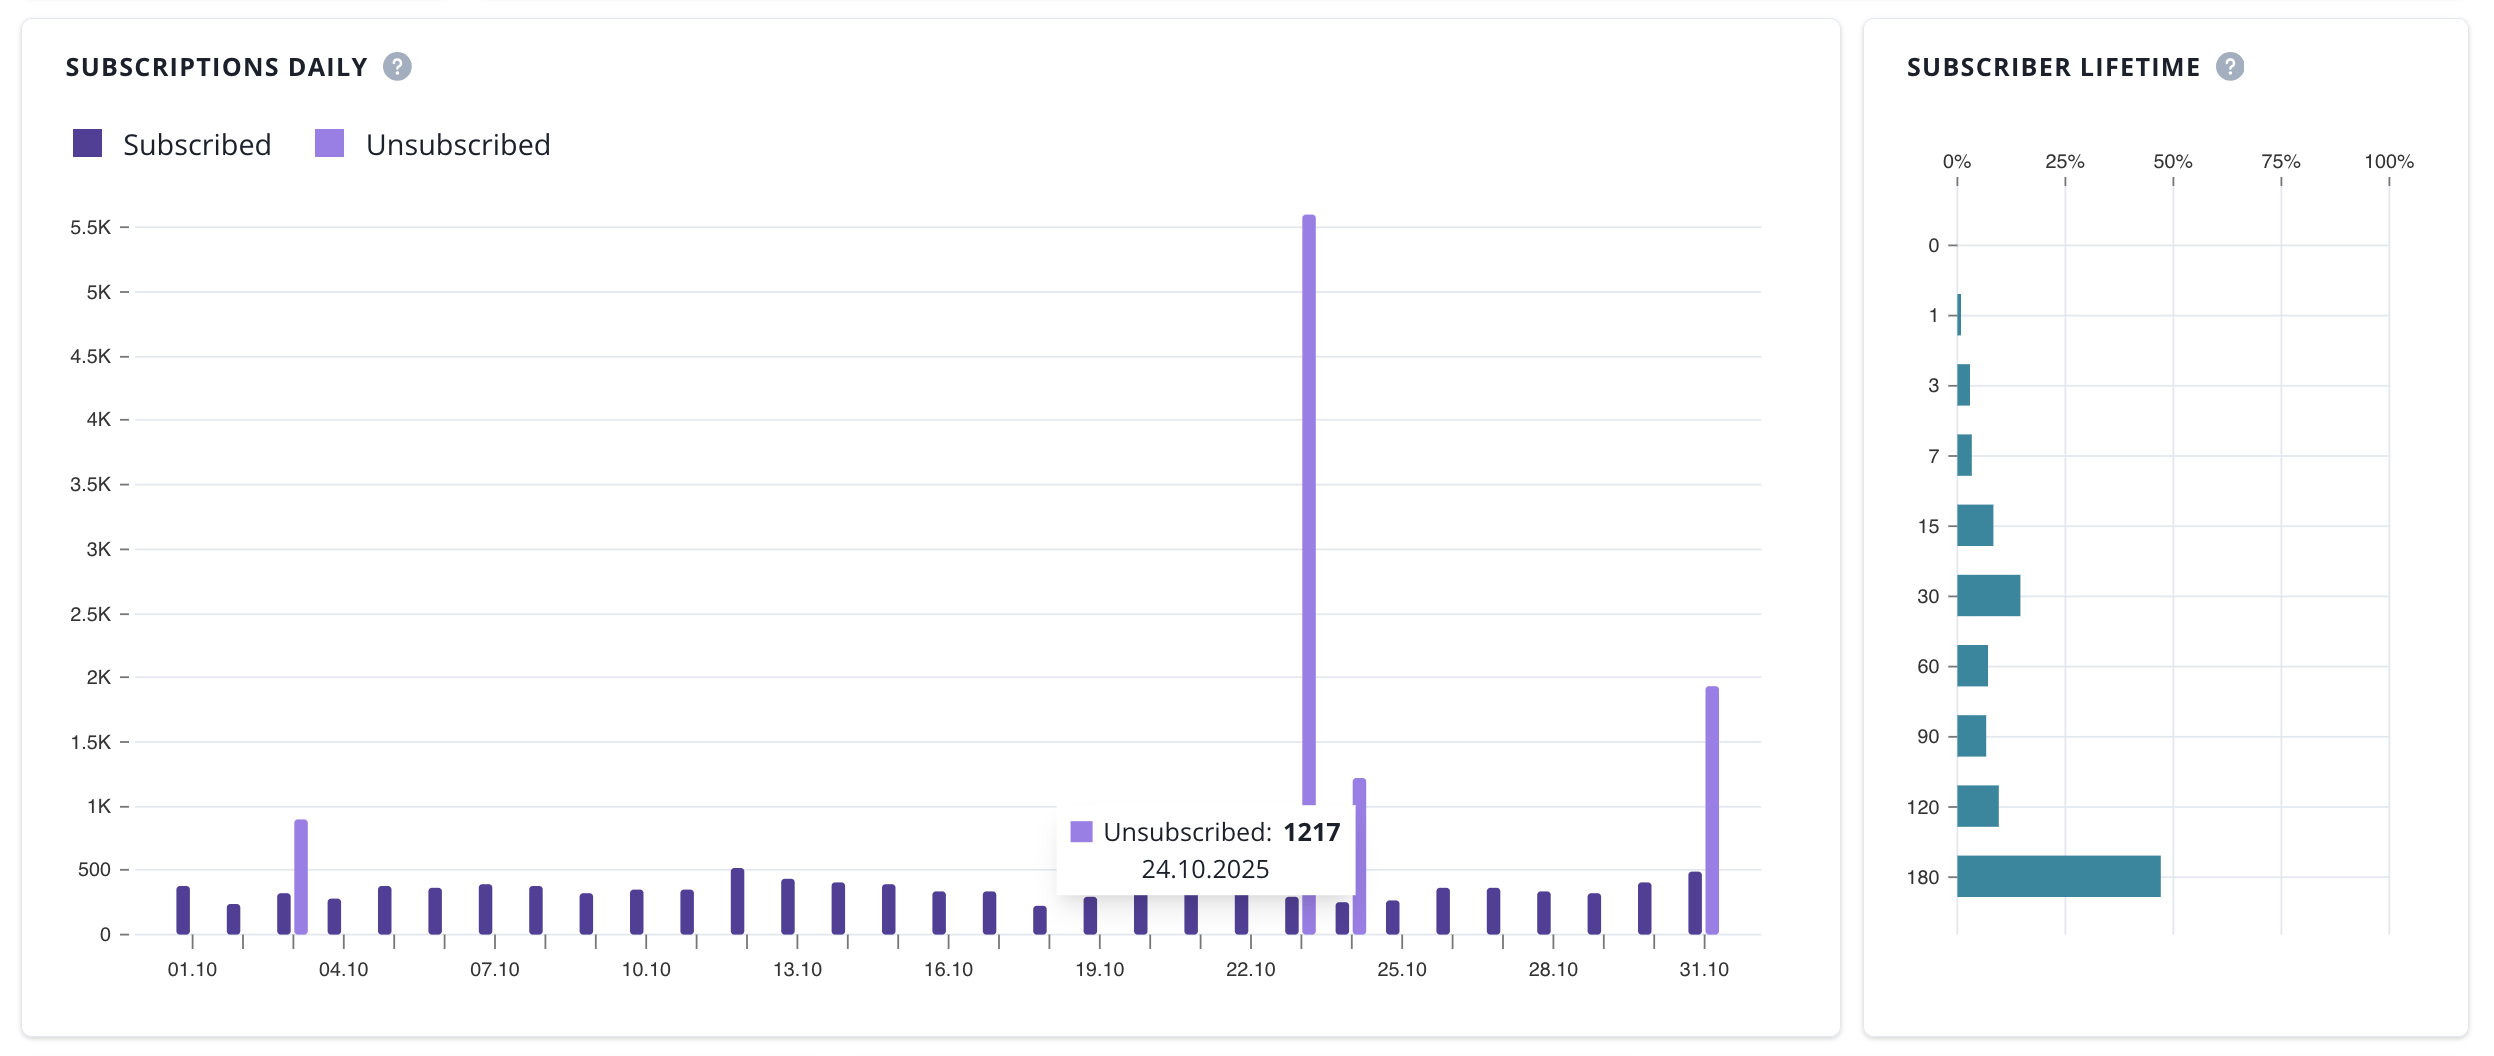
Next, there is a chart showing daily subscriptions and unsubscriptions, and a chart presenting a subscriber lifetime.
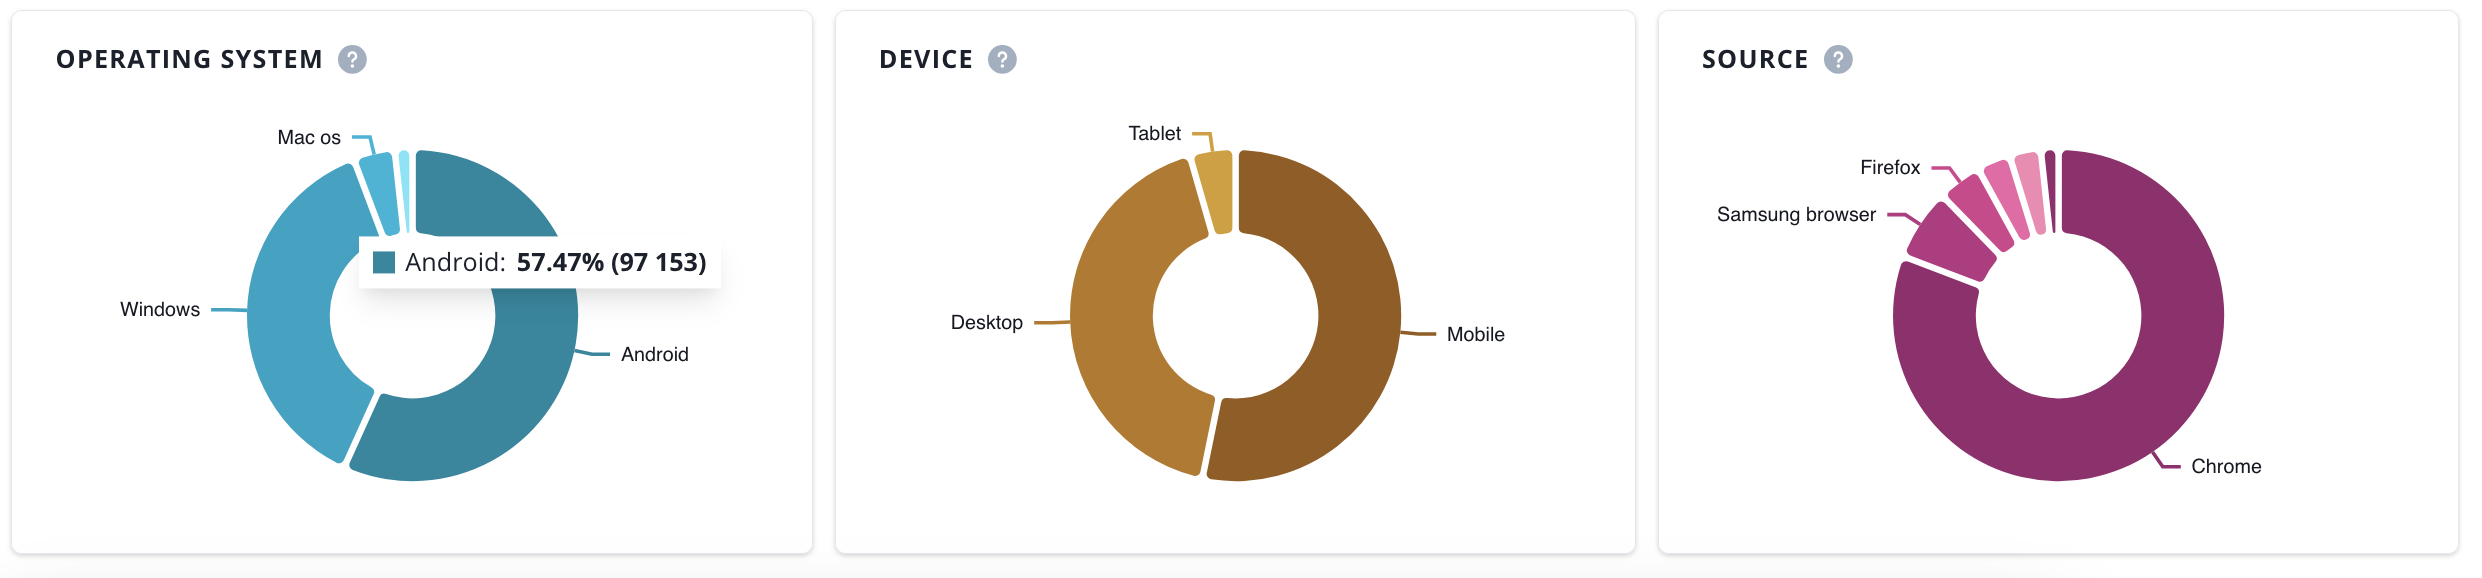
At the bottom of the page, there are three doughnut charts showing the percentage share of different operating systems, devices, and sources of your subscriptions.
Push notifications
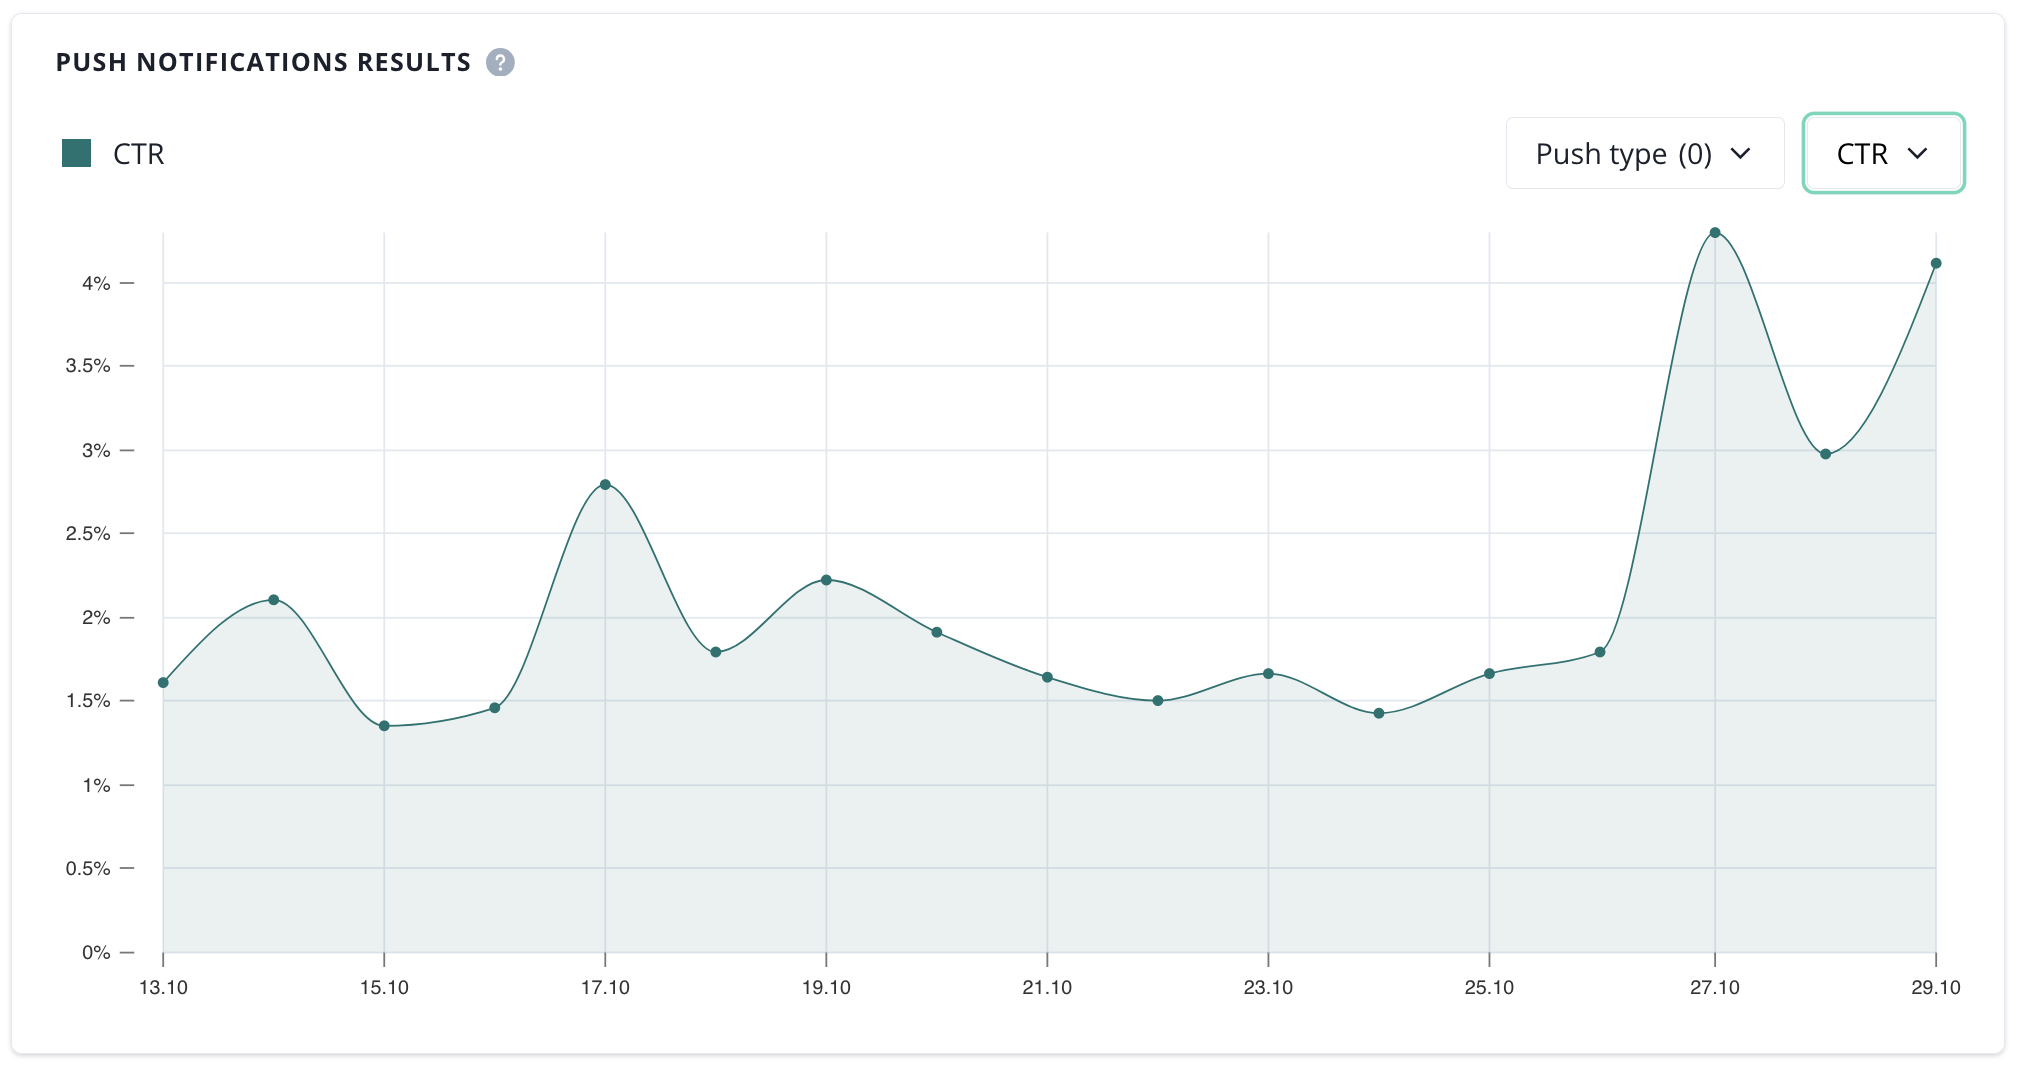
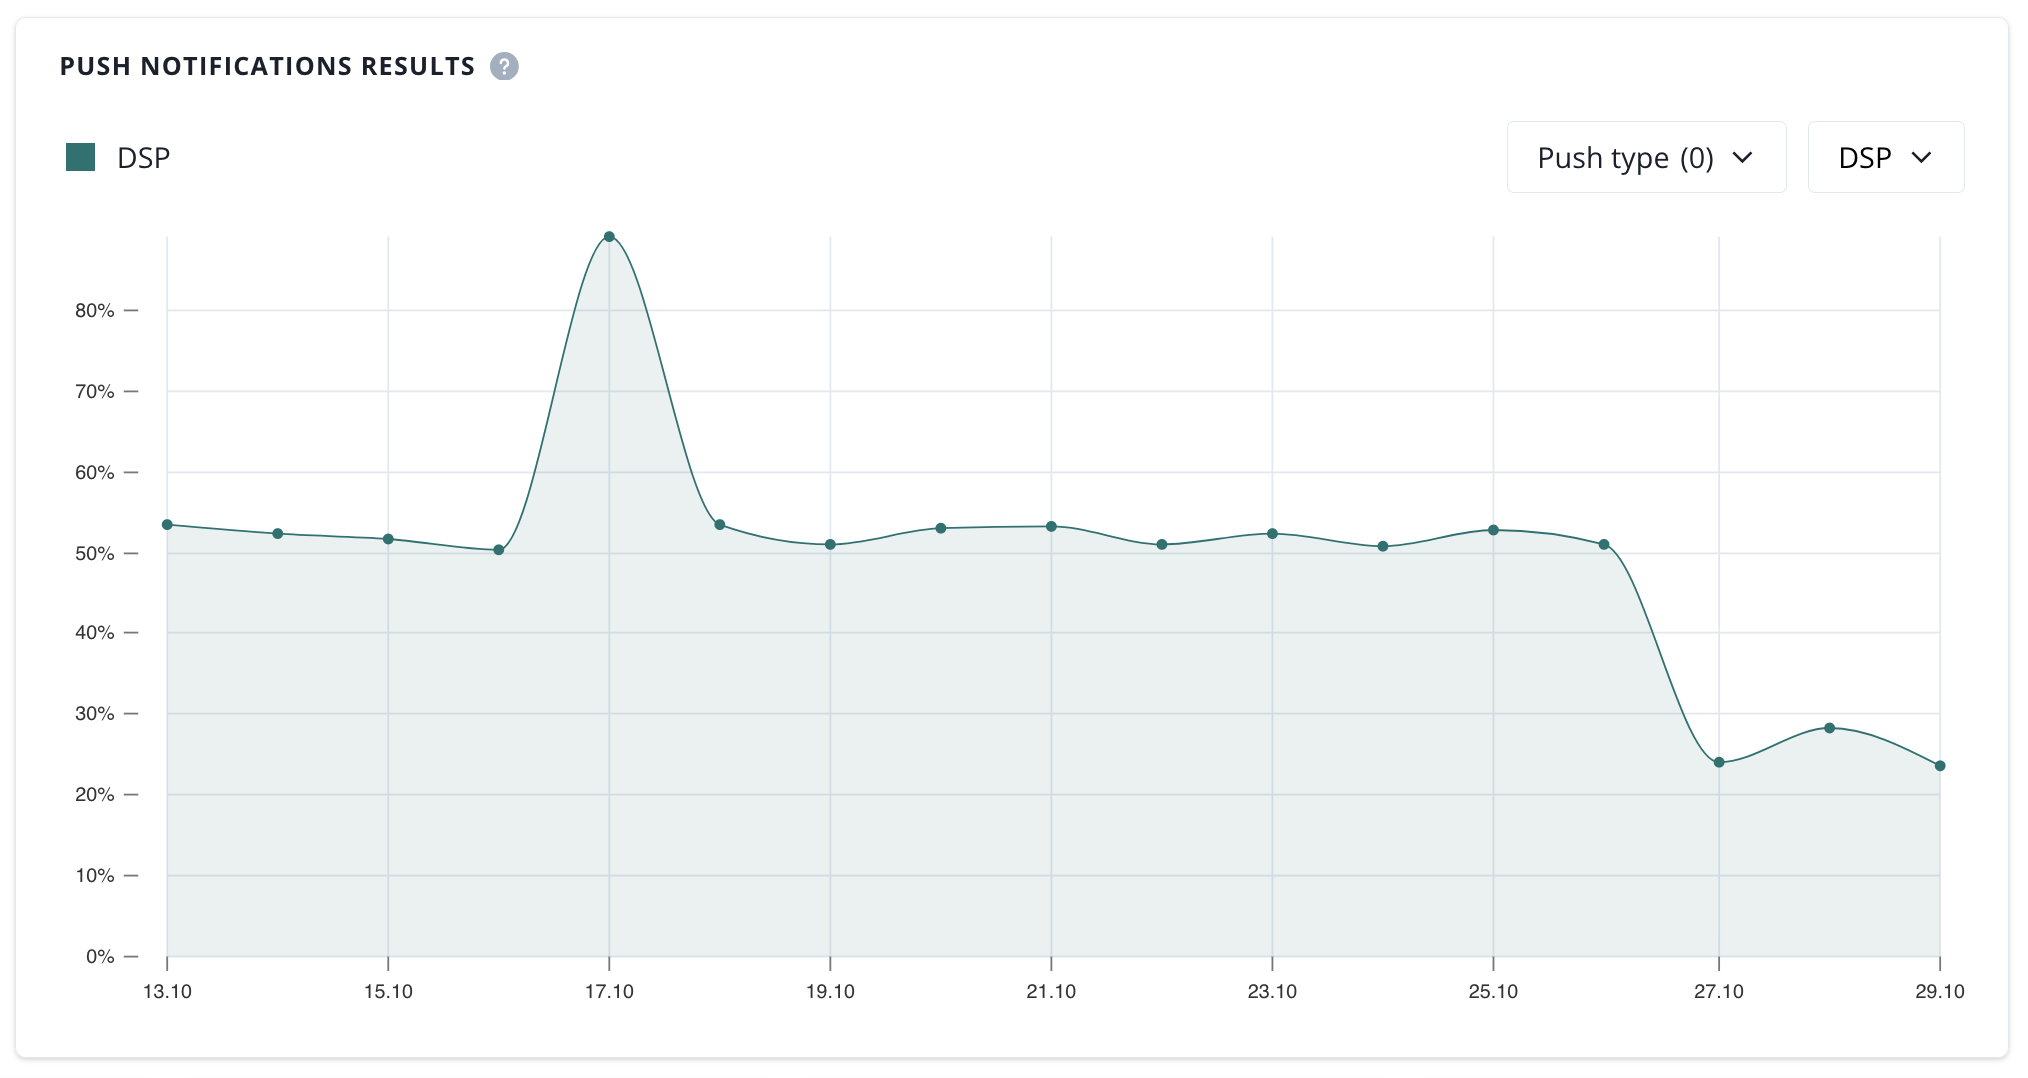
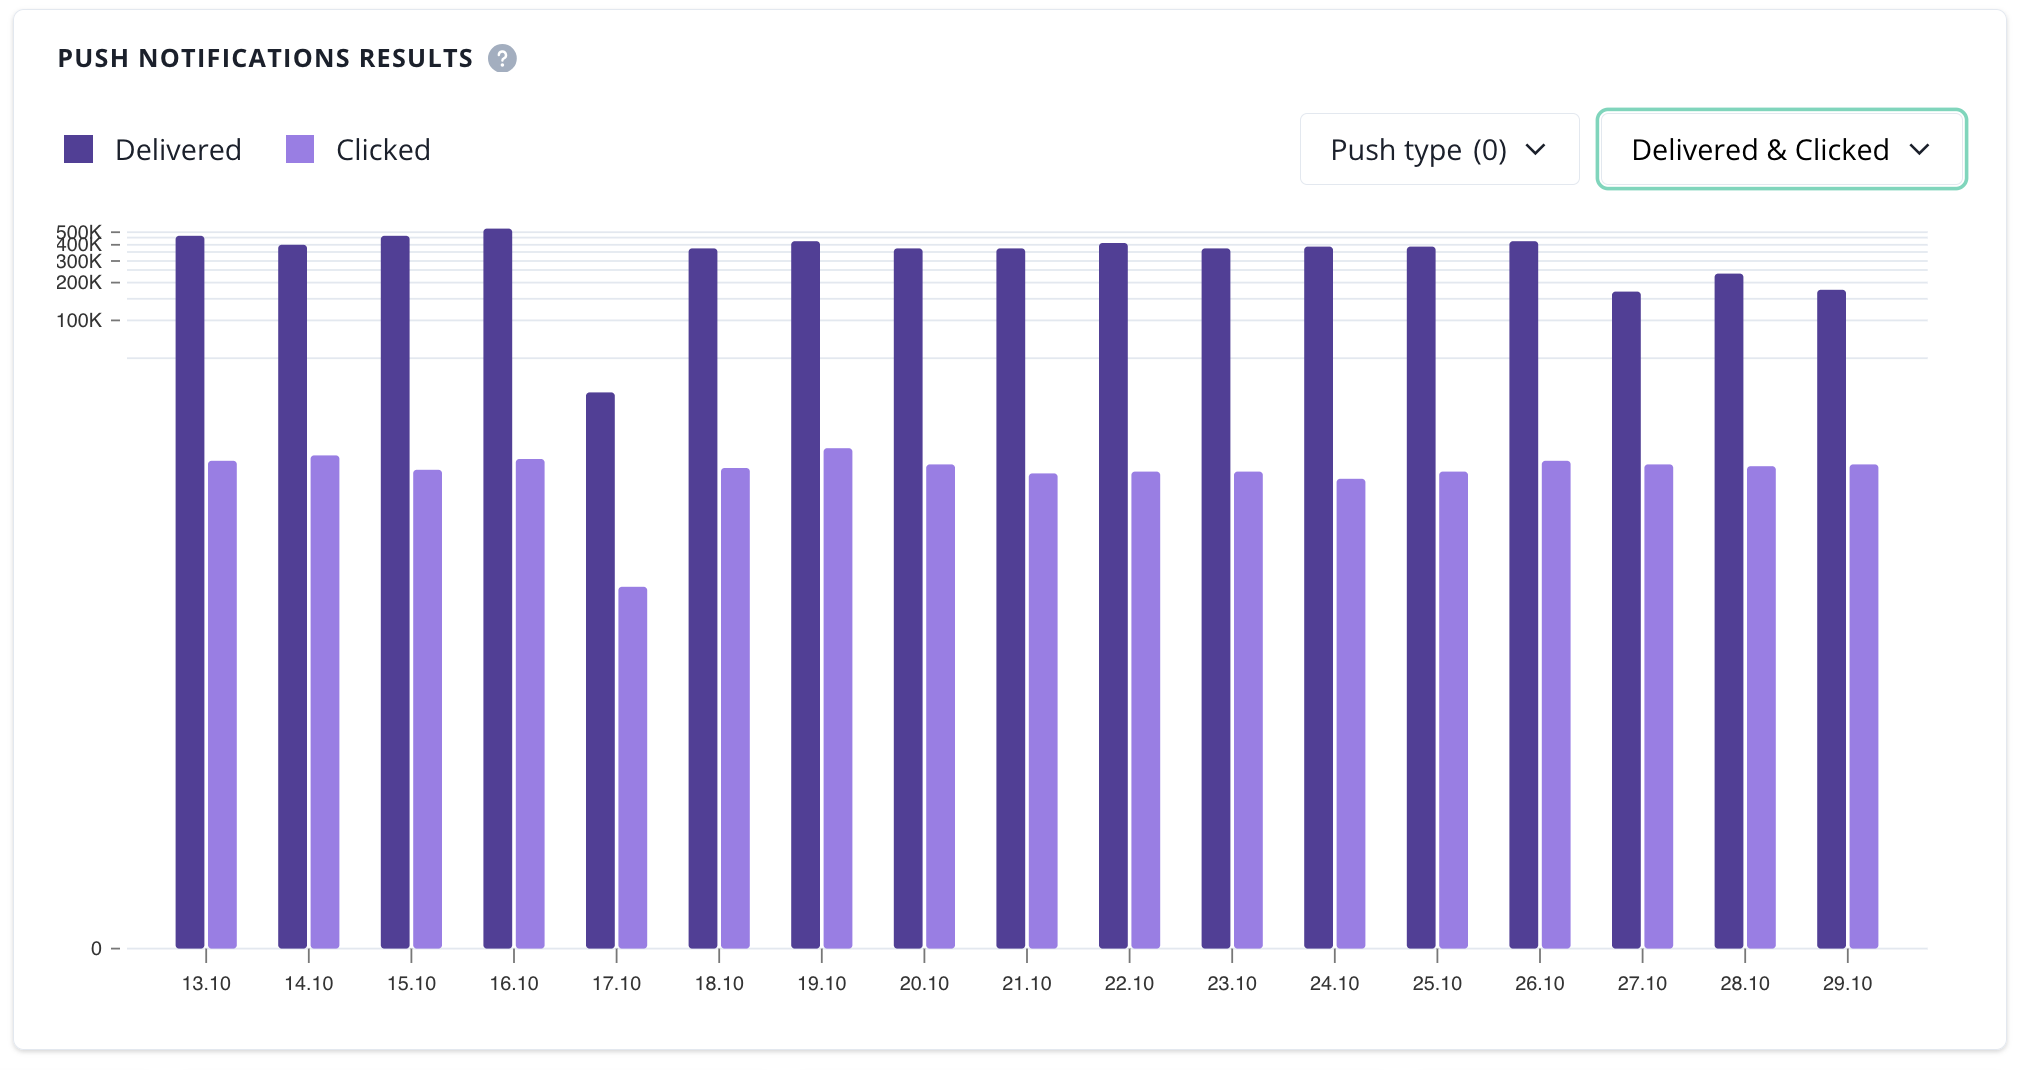
Push notifiactions page contains two charts with numbers refering to push notifications across your organization.
CTR chart
DSP chart
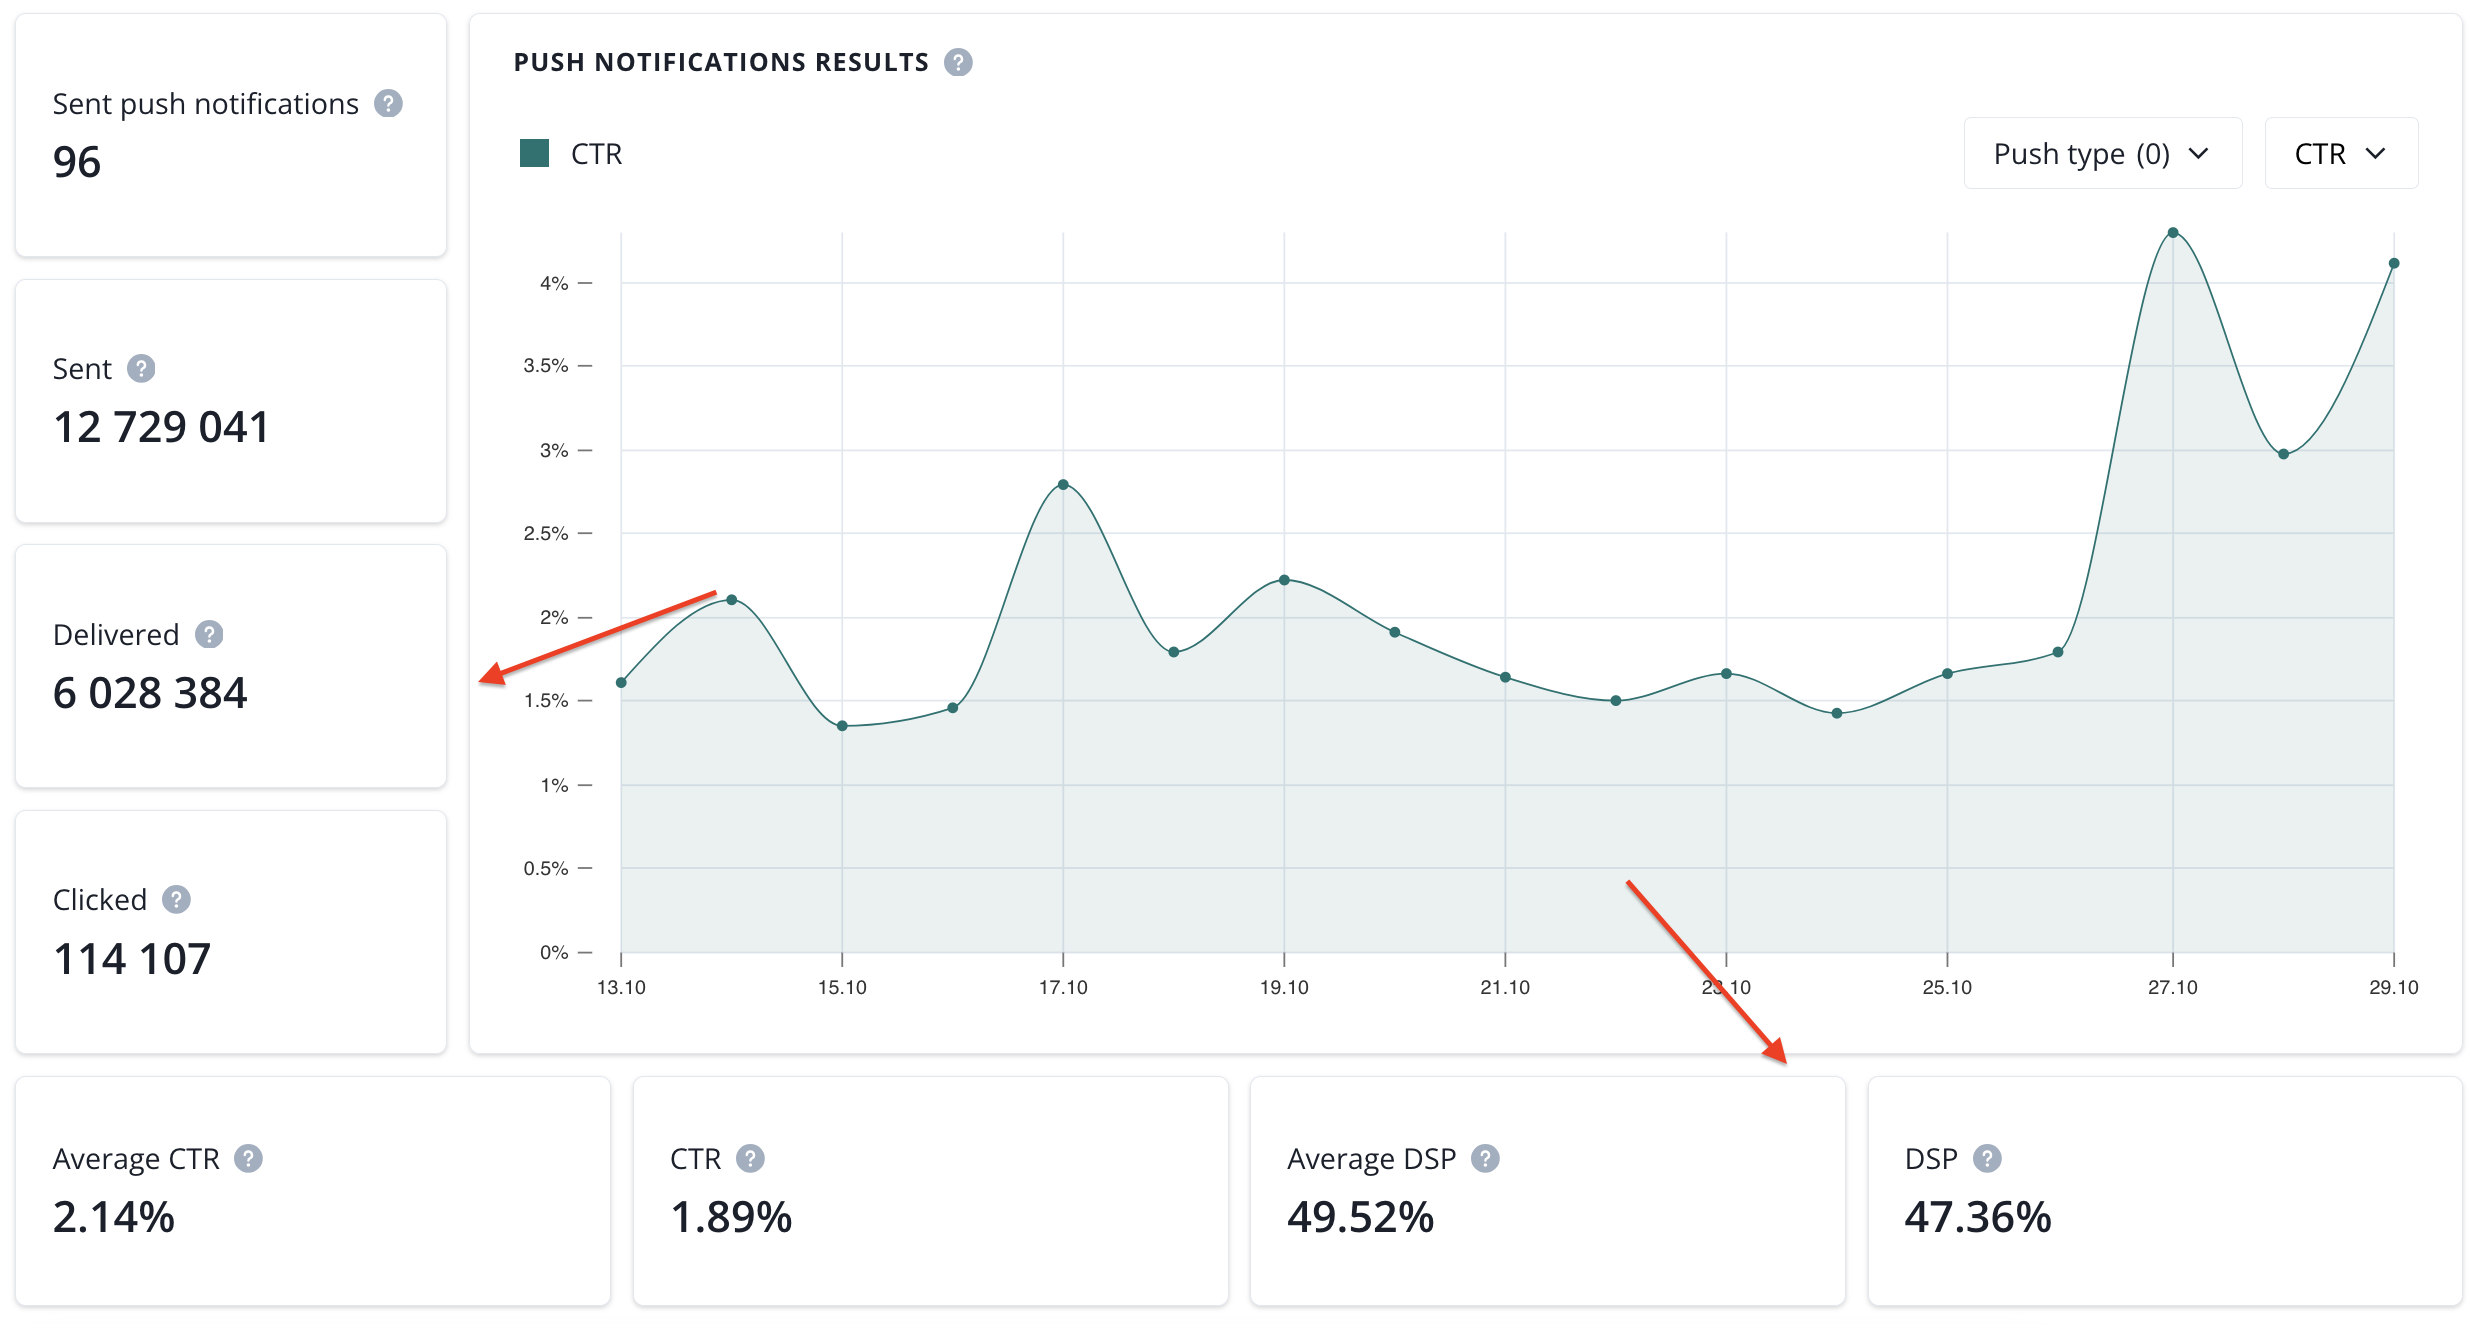
- sent push notifications (number of push campiangs sent in a selected date range),
- sent (number of sent notifications in a selected date range),
- delivered (number of delivered notifications in a selected date range),
- clicked (number of clicked notifications in a selected date range),
- CTR (click-through rate in a selected time range),
- average CTR (average click-through rate in a selected time range),
- DSP (deliverability rate in a selected time range),
- average DSP (average deliverability rate in a selected time range).
These numbers can be filtered by the date range and platform: web/mobile.

Next, we have more tables and charts that show numbers related to your push campaign;
1. comparing results of push campaign by targeting type,

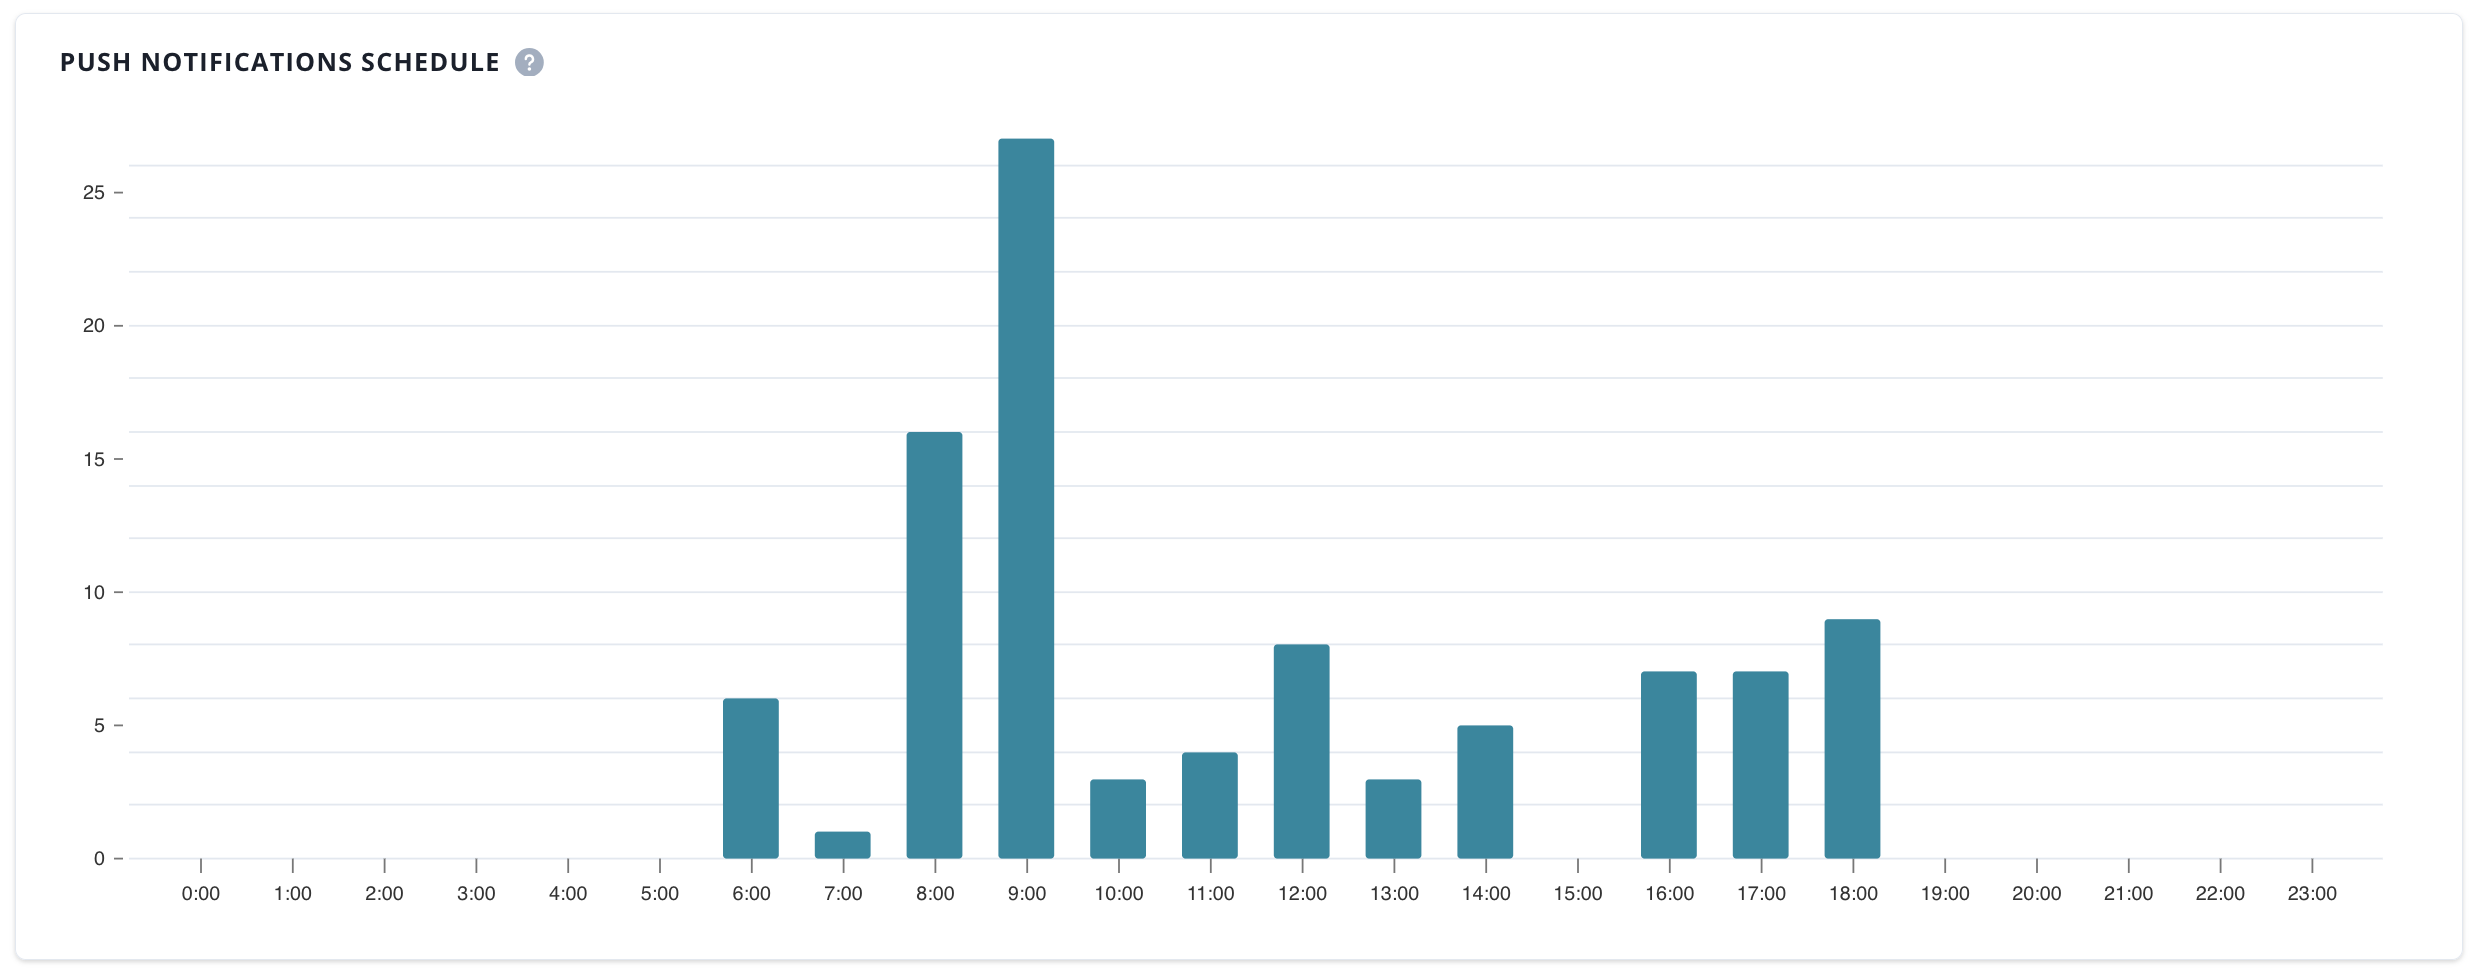
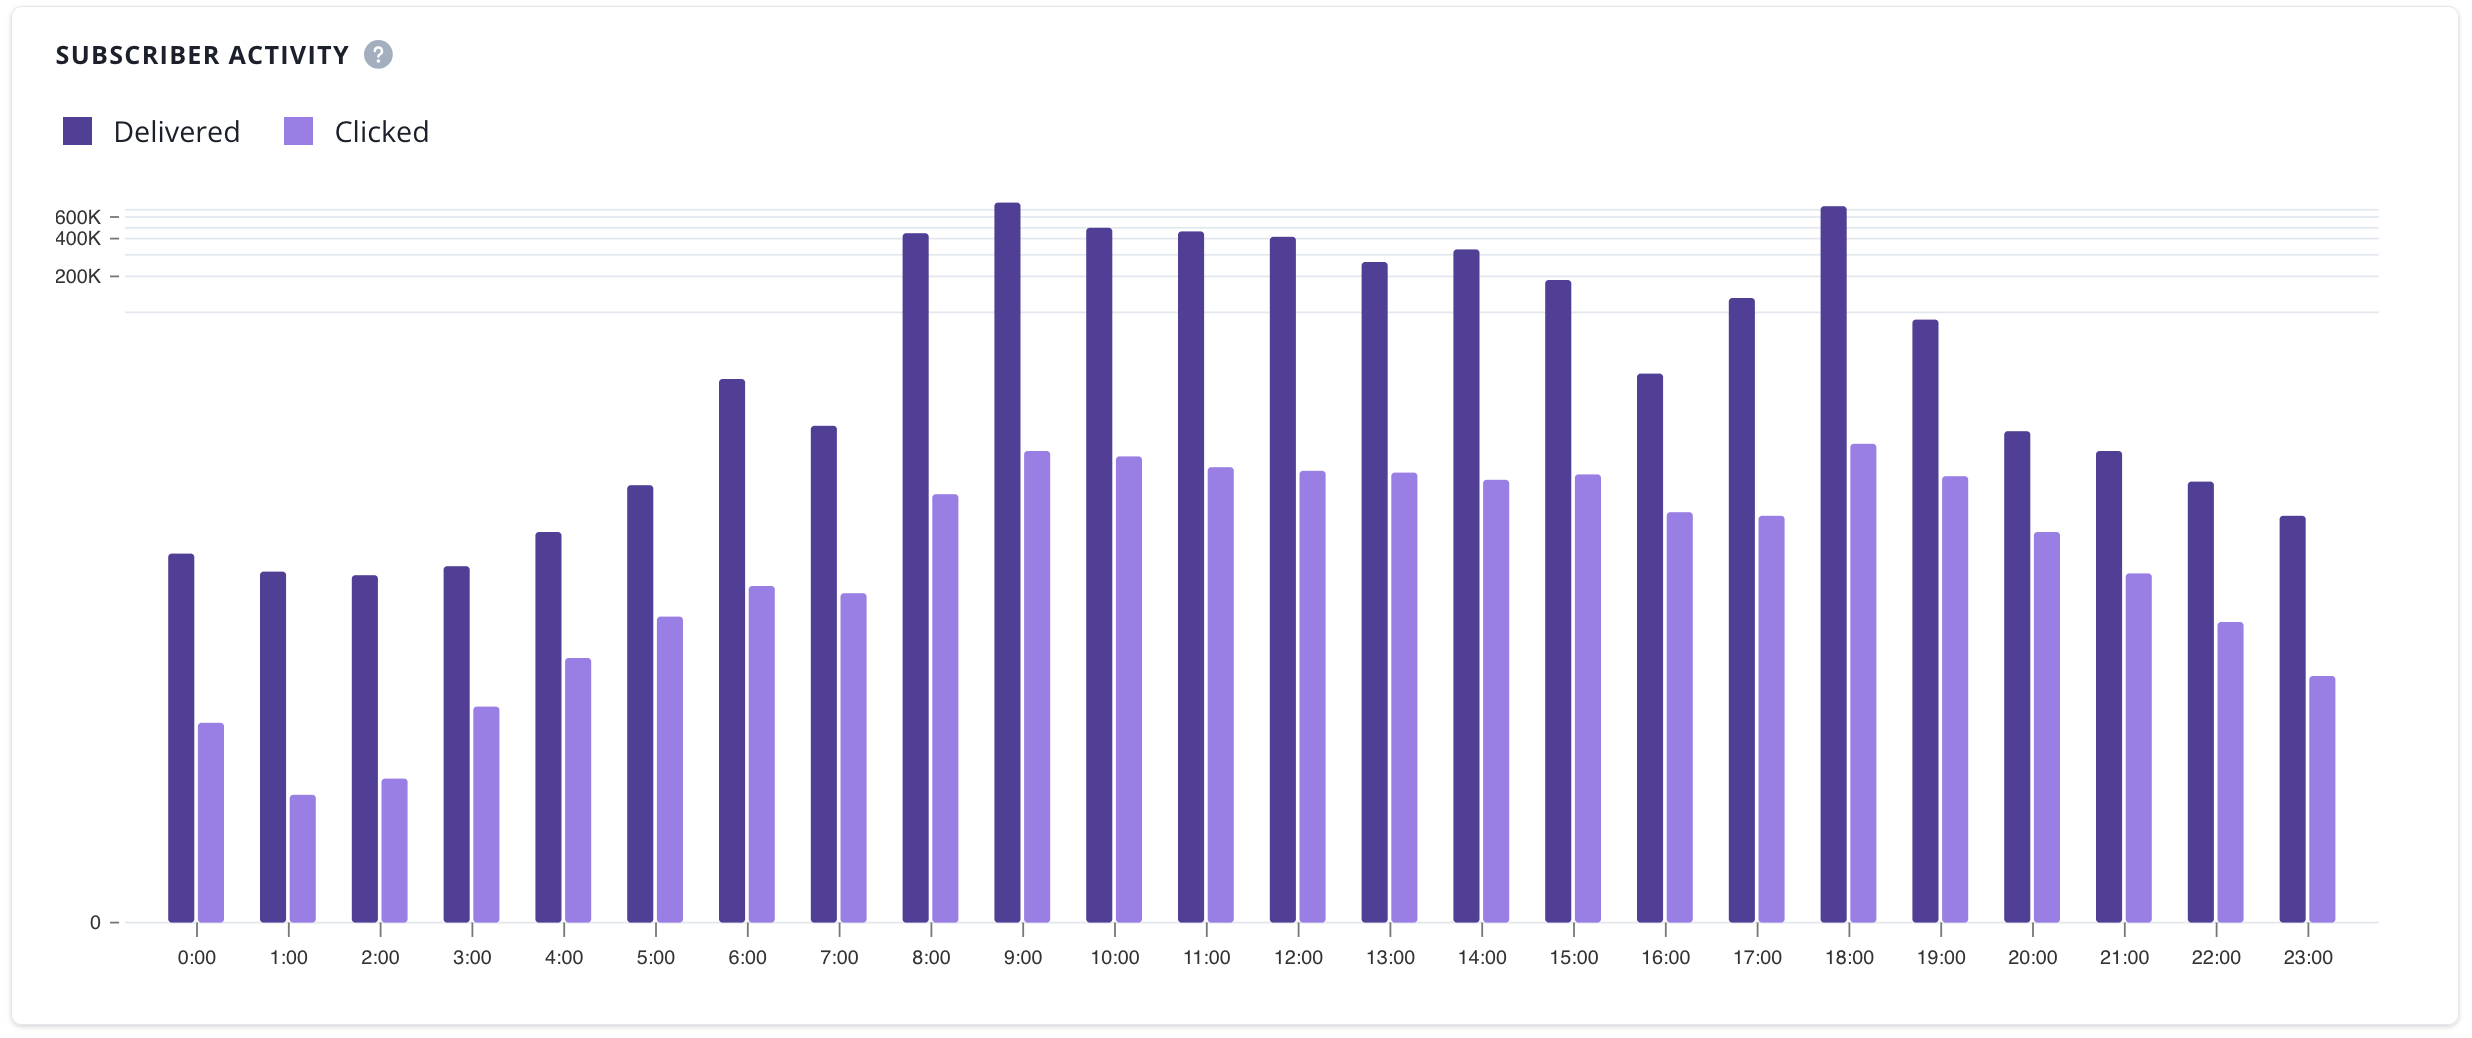
3. when your subscribers are being active (delivered and clicked by hour of the day),
4. average CTR and Average DS,

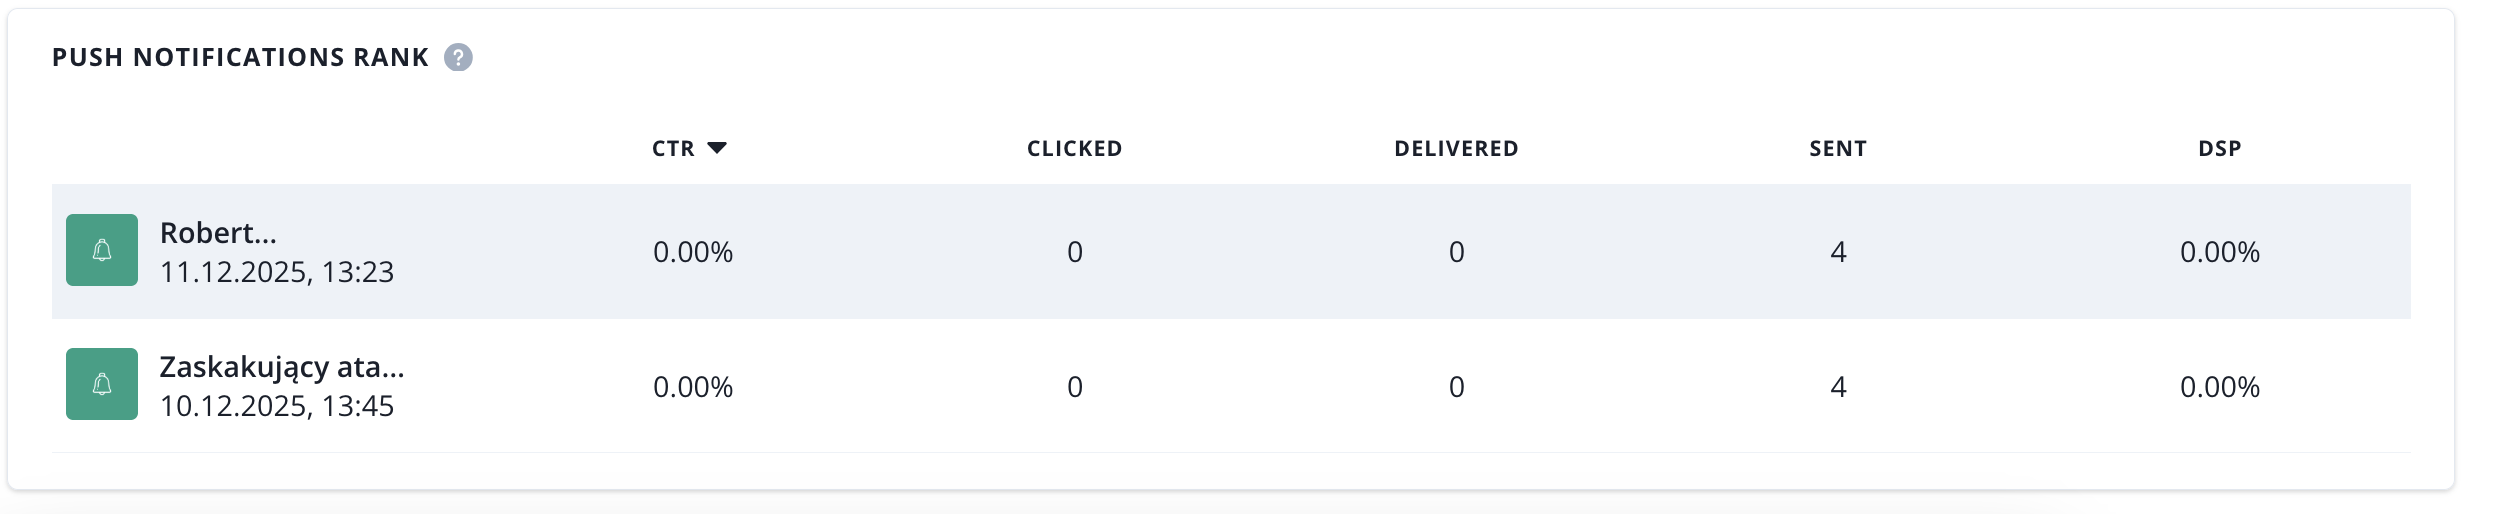
5. campaign rank that can be organised by CTR, clicks, DSP, delivered, sent.
Automation
Here you will find all numbers regarding your push notification automations. First, we have three types of charts with automation results.
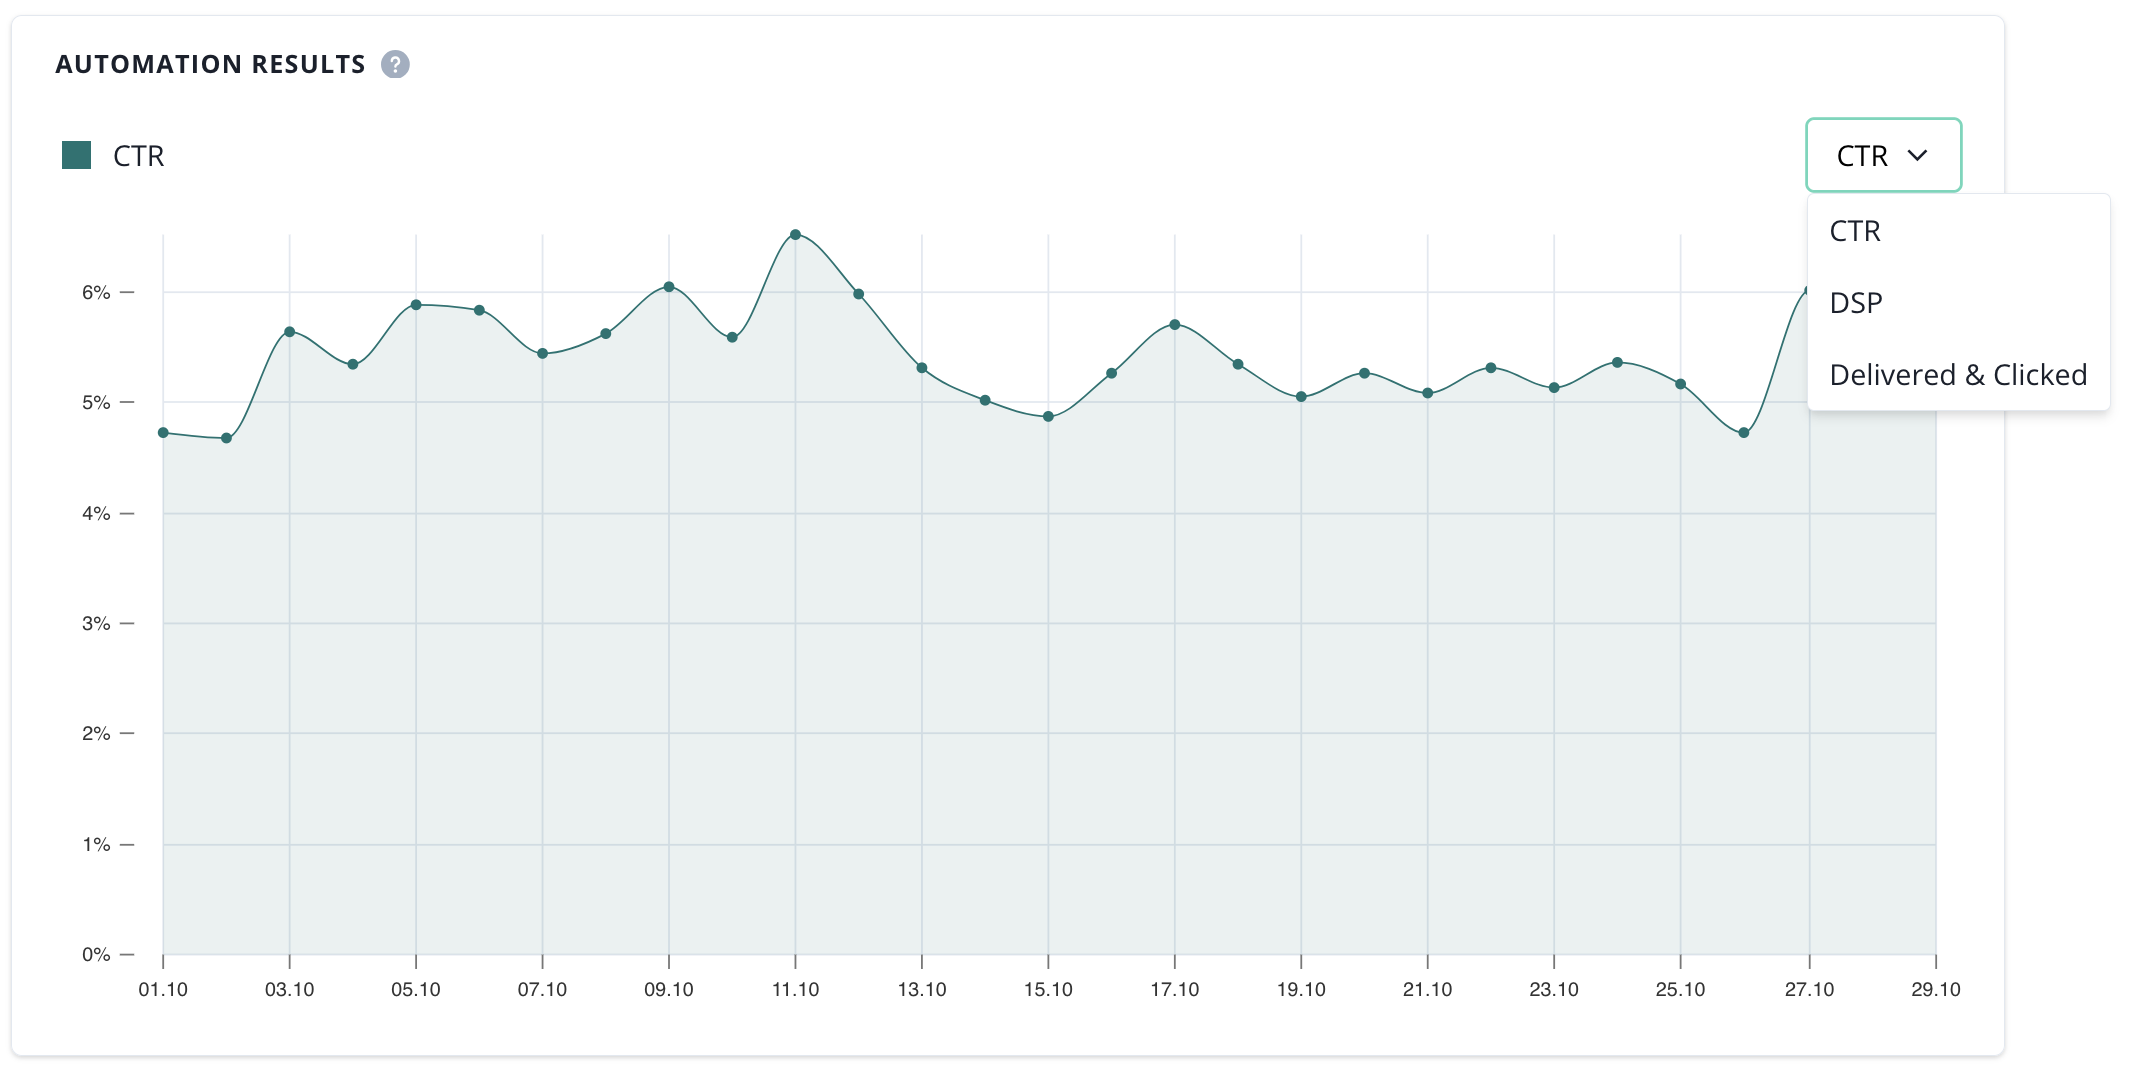
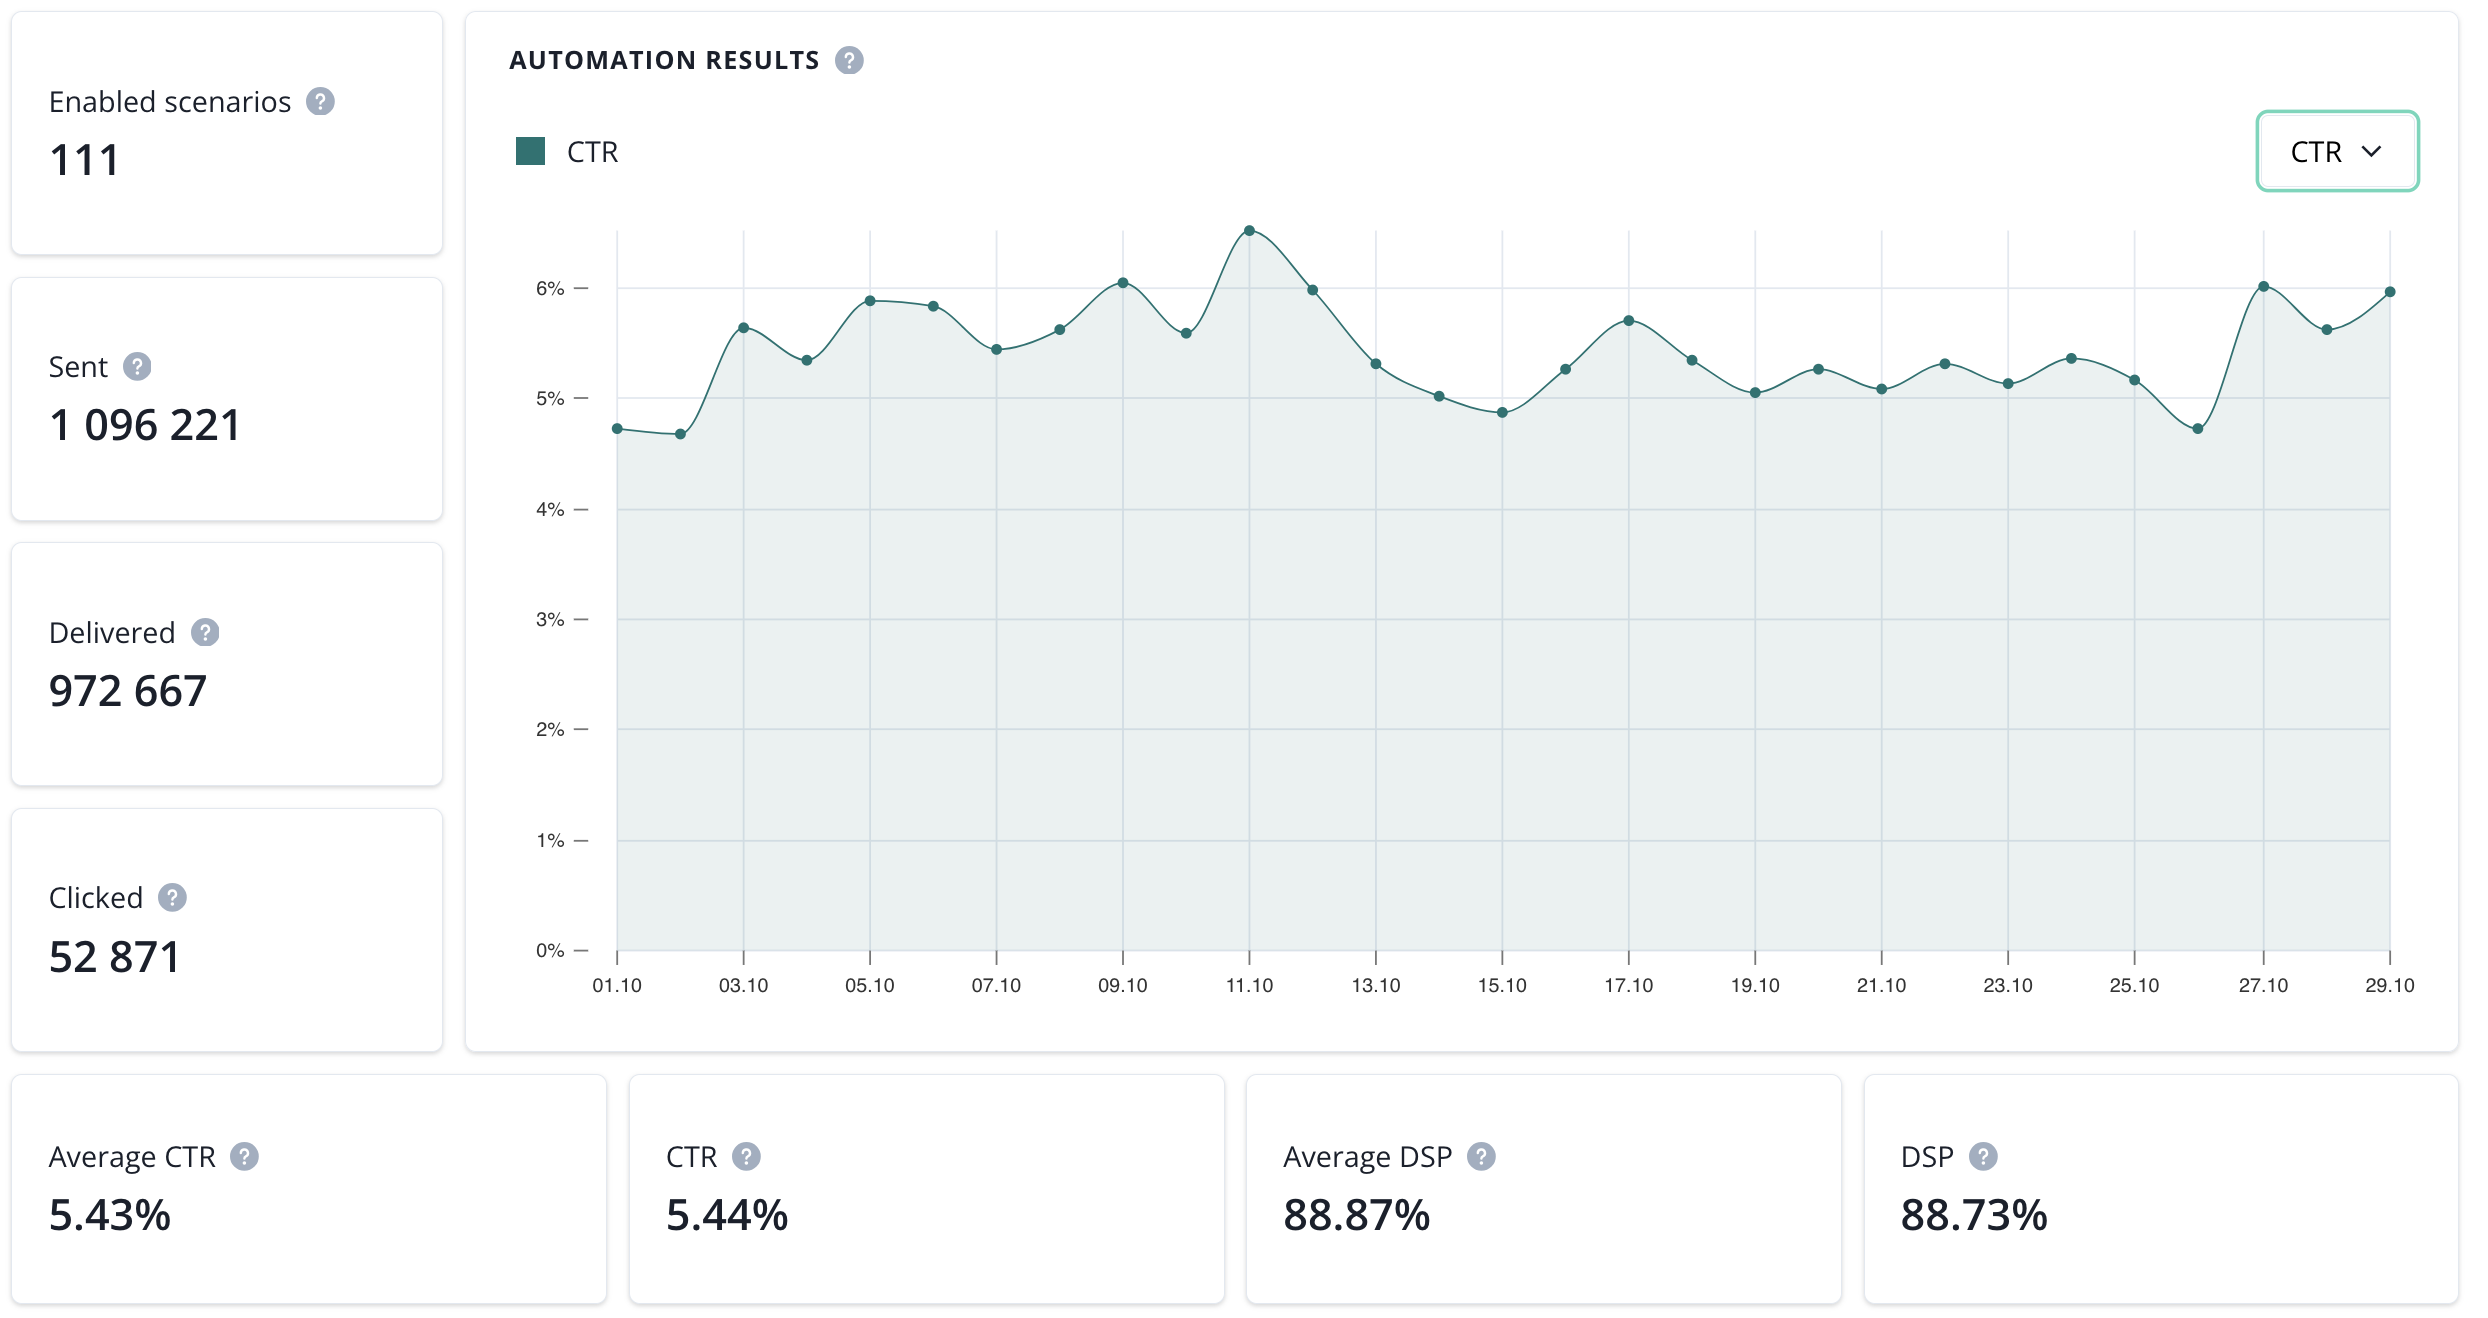
- enabled scenarios (number of automation scenarios with push casmpaigns that are currently enabled),
- sent (number of sent notifications in a selected date range),
- delivered (number of delivered notifications in a selected date range),
- clicked (number of clicked notifications in a selected date range),
- average CTR (average click-through rate in a selected time range),
- CTR (click-through rate in a selected time range),
- average DSP (average deliverability rate in a selected time range).
- DSP (deliverability rate in a selected time range).
The final section consist of the Average automation CTR and DSP and automation rank:
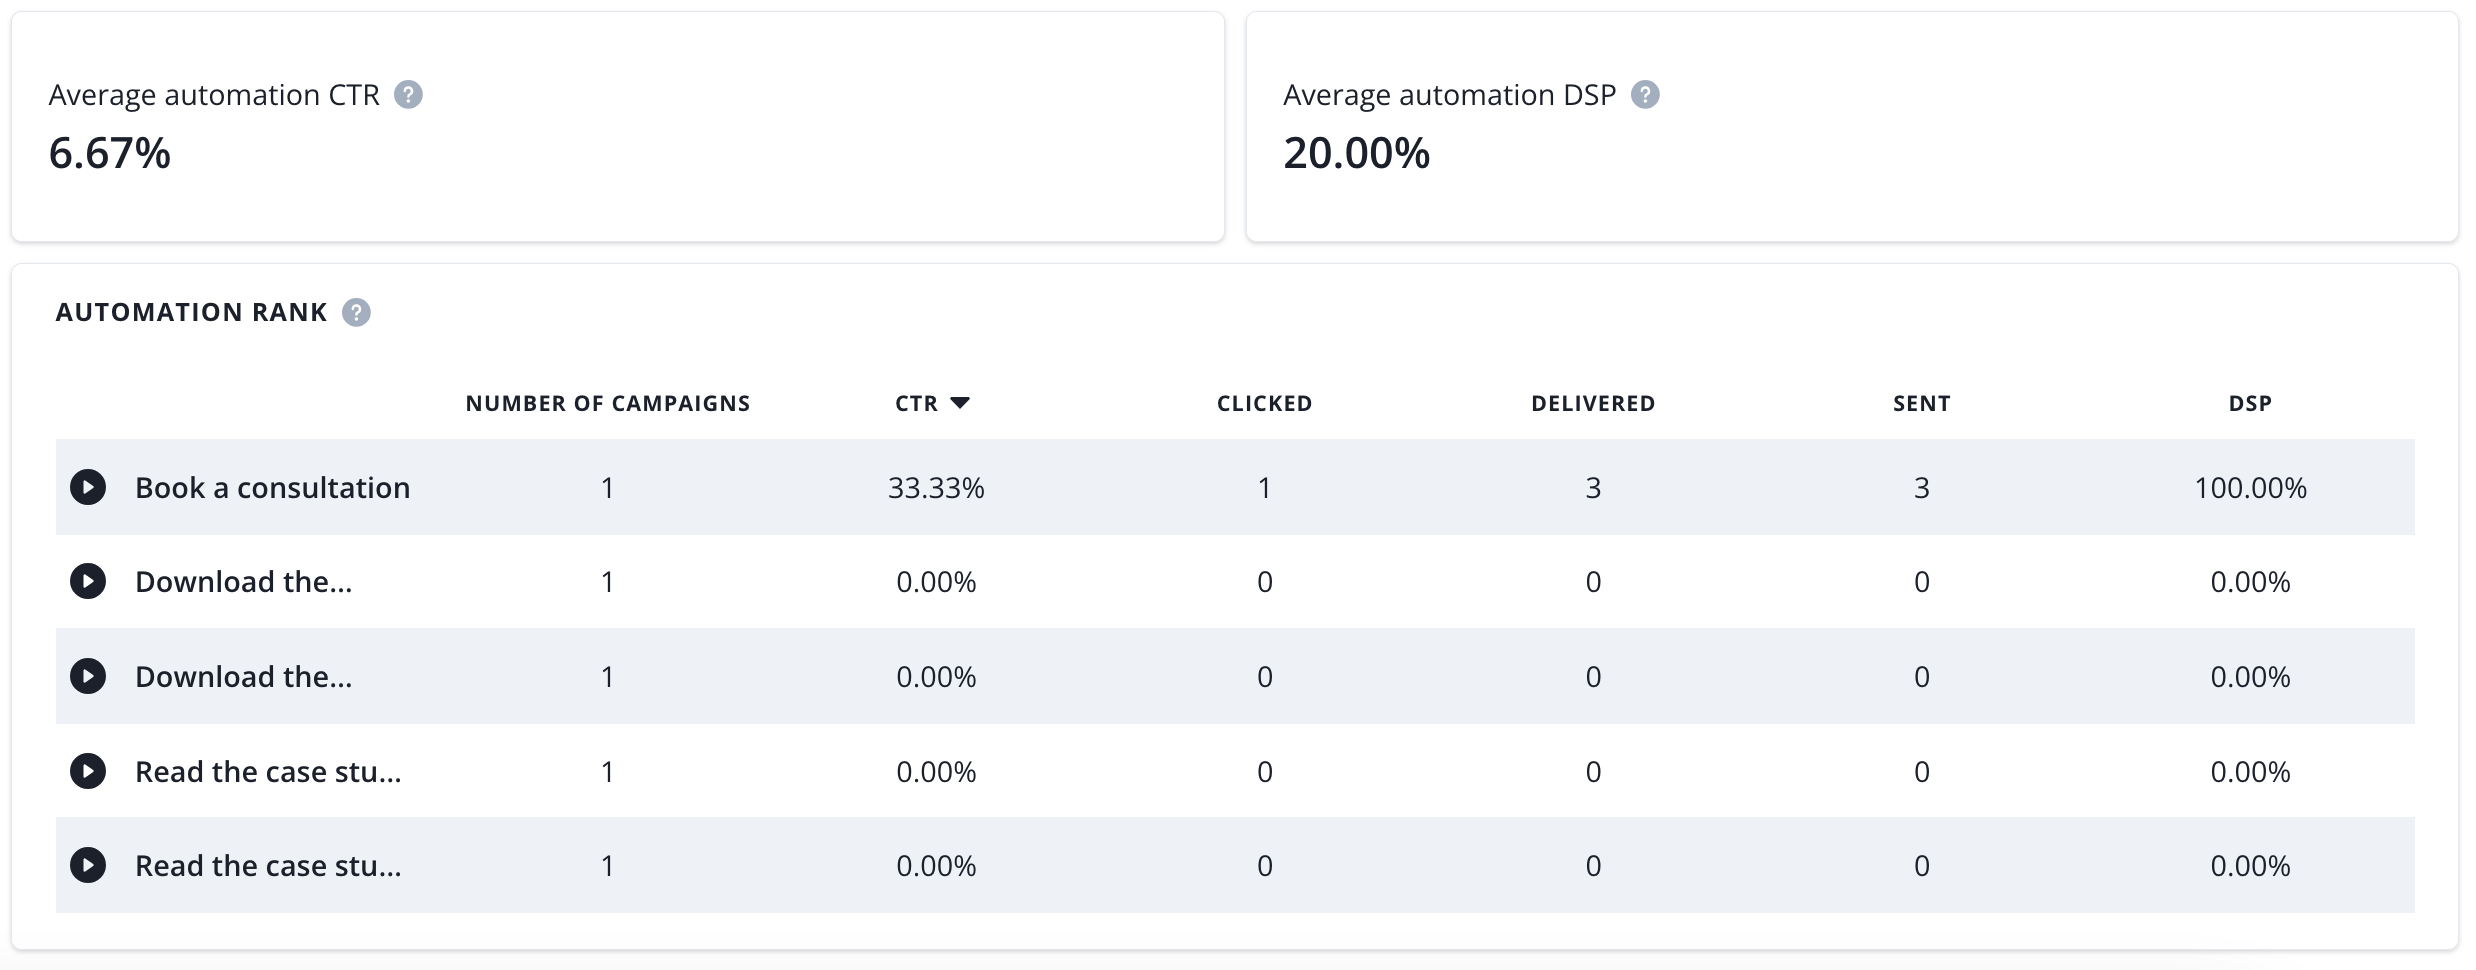
- average automation CTR (average click-through rate of automation scenarios in a selected time range),
- average campaign DSP (average deliverability rate of autmations scenarios in a selected time range),
- campaign rank (list of automations with push campaigns sent in a selected time range with statistics).
Compare projects
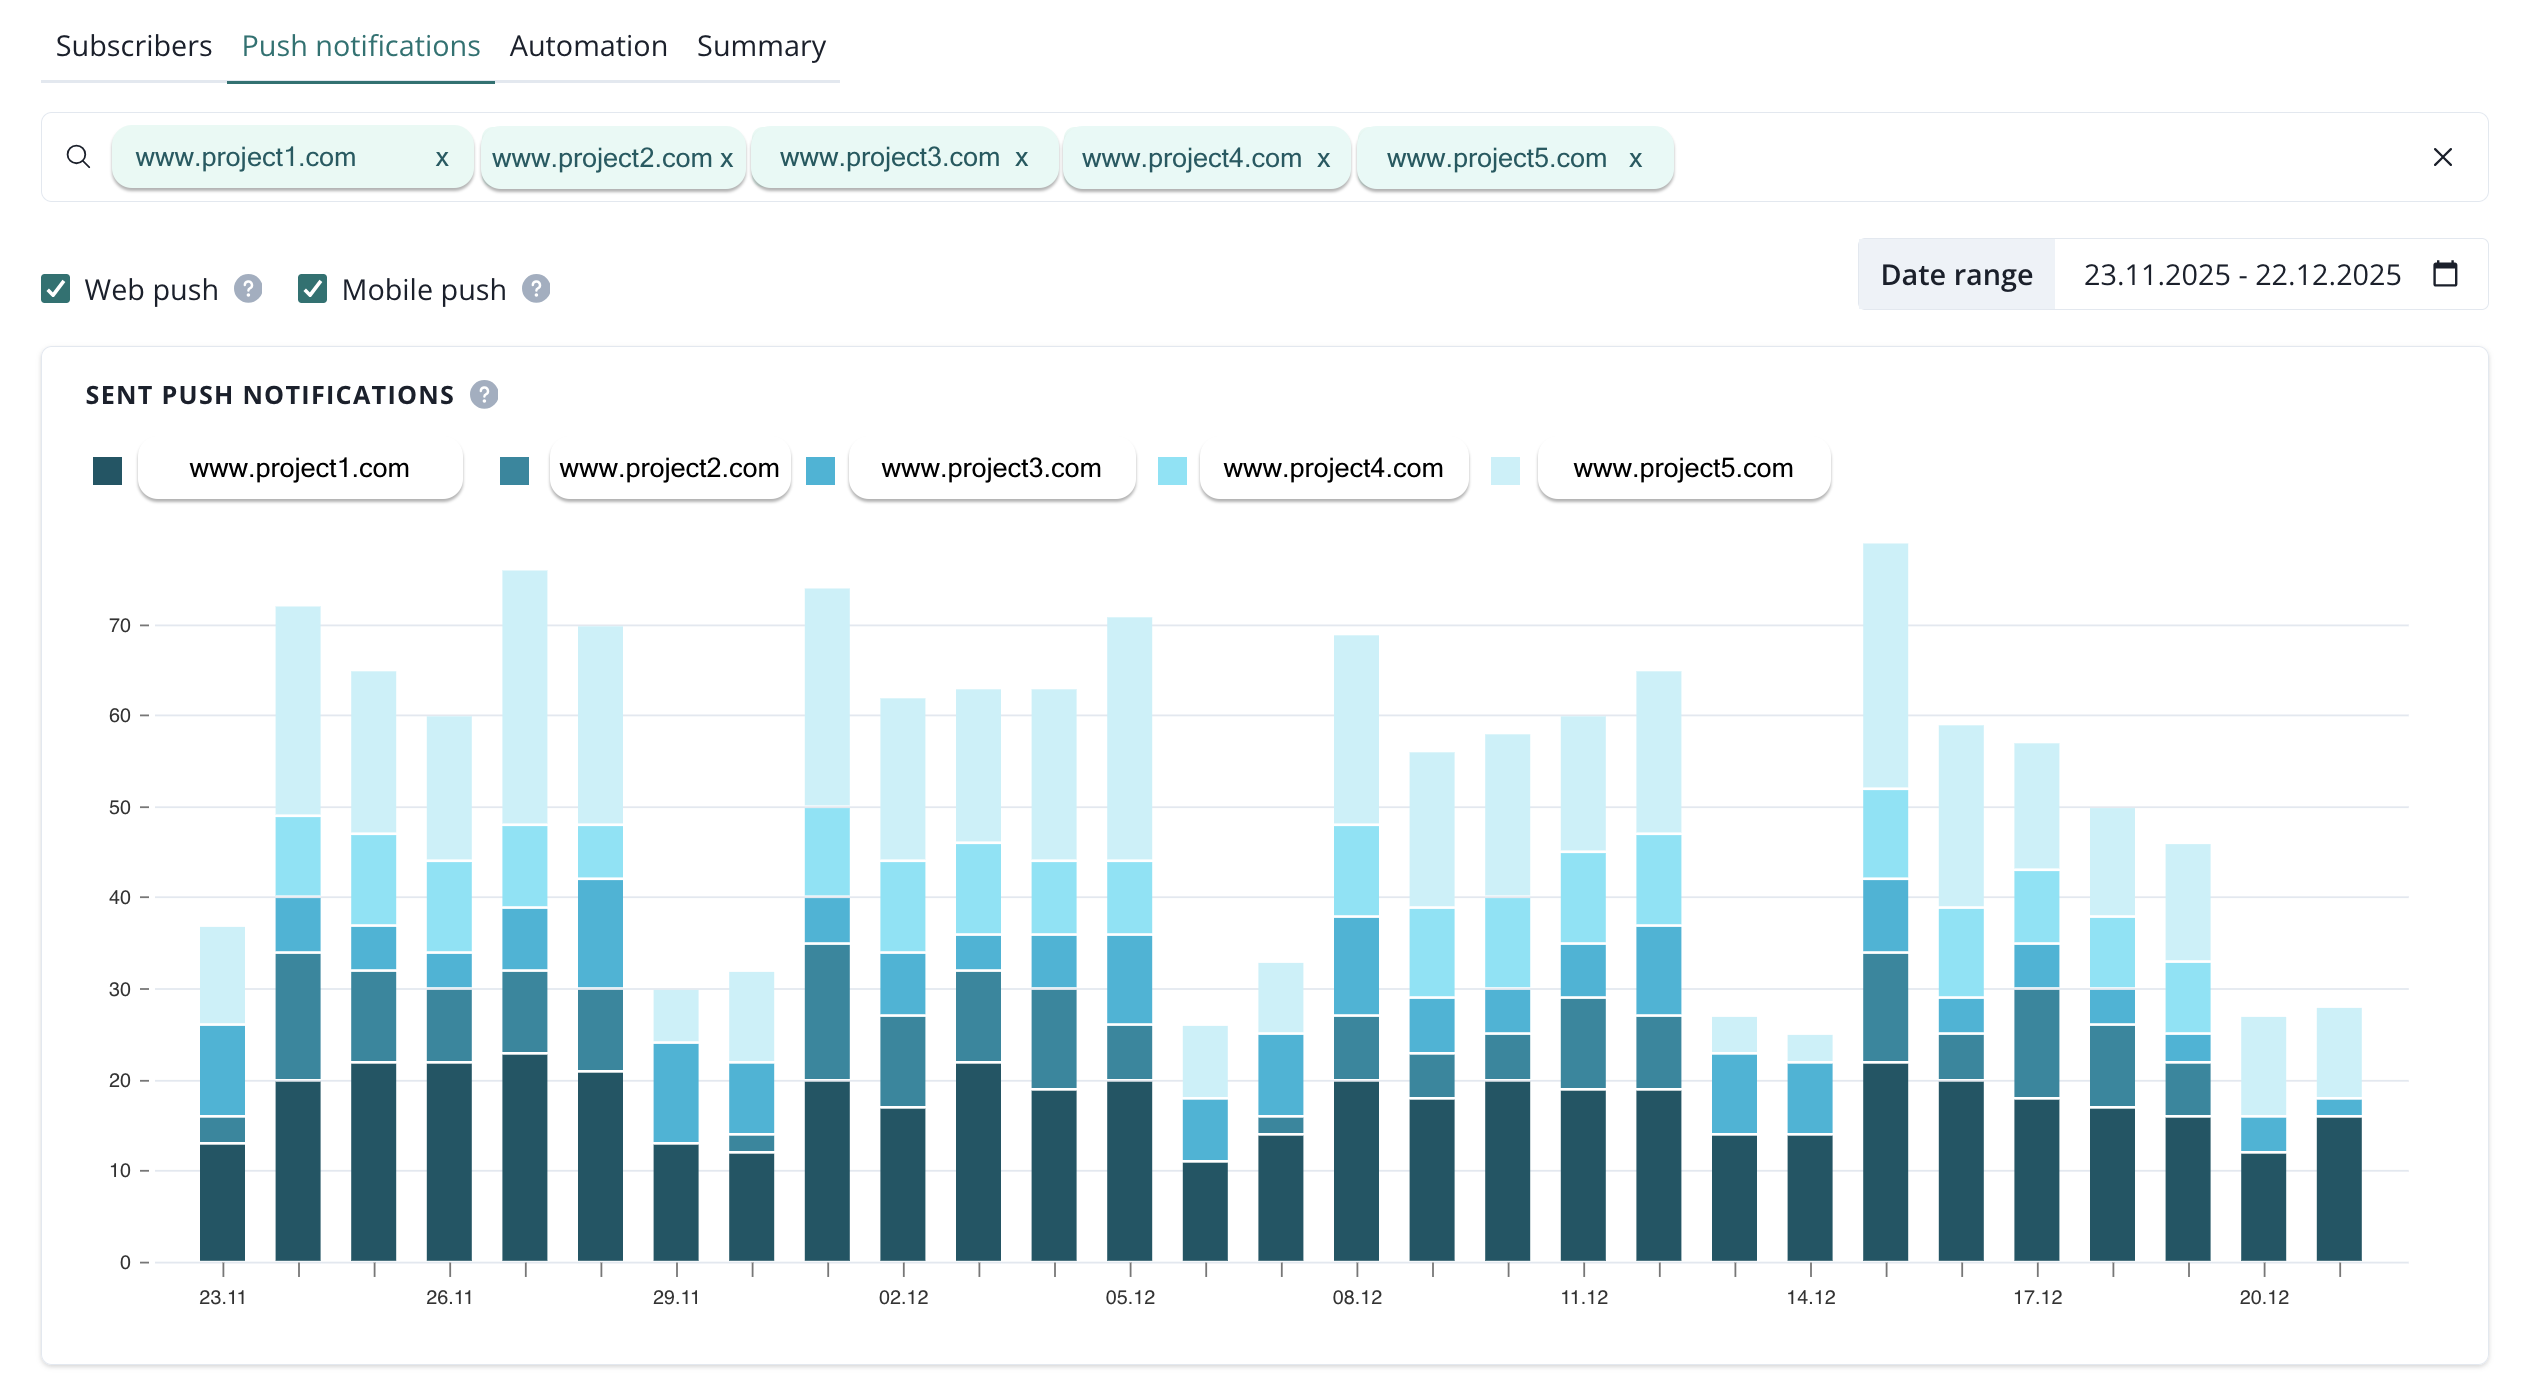
This page is dedicated to organizations that have at least 2 or more projects. It allows you to compare your numbers in terms of subscriptions, push notifications and automations. There are four sections; Subscribers, Push notifications, Automations and Summary.
Subscribers
You will find here three tables that allow you to compare maxiumum 5 projects at a time (you can choose which projects to compare if there is more than 5 in your organization).
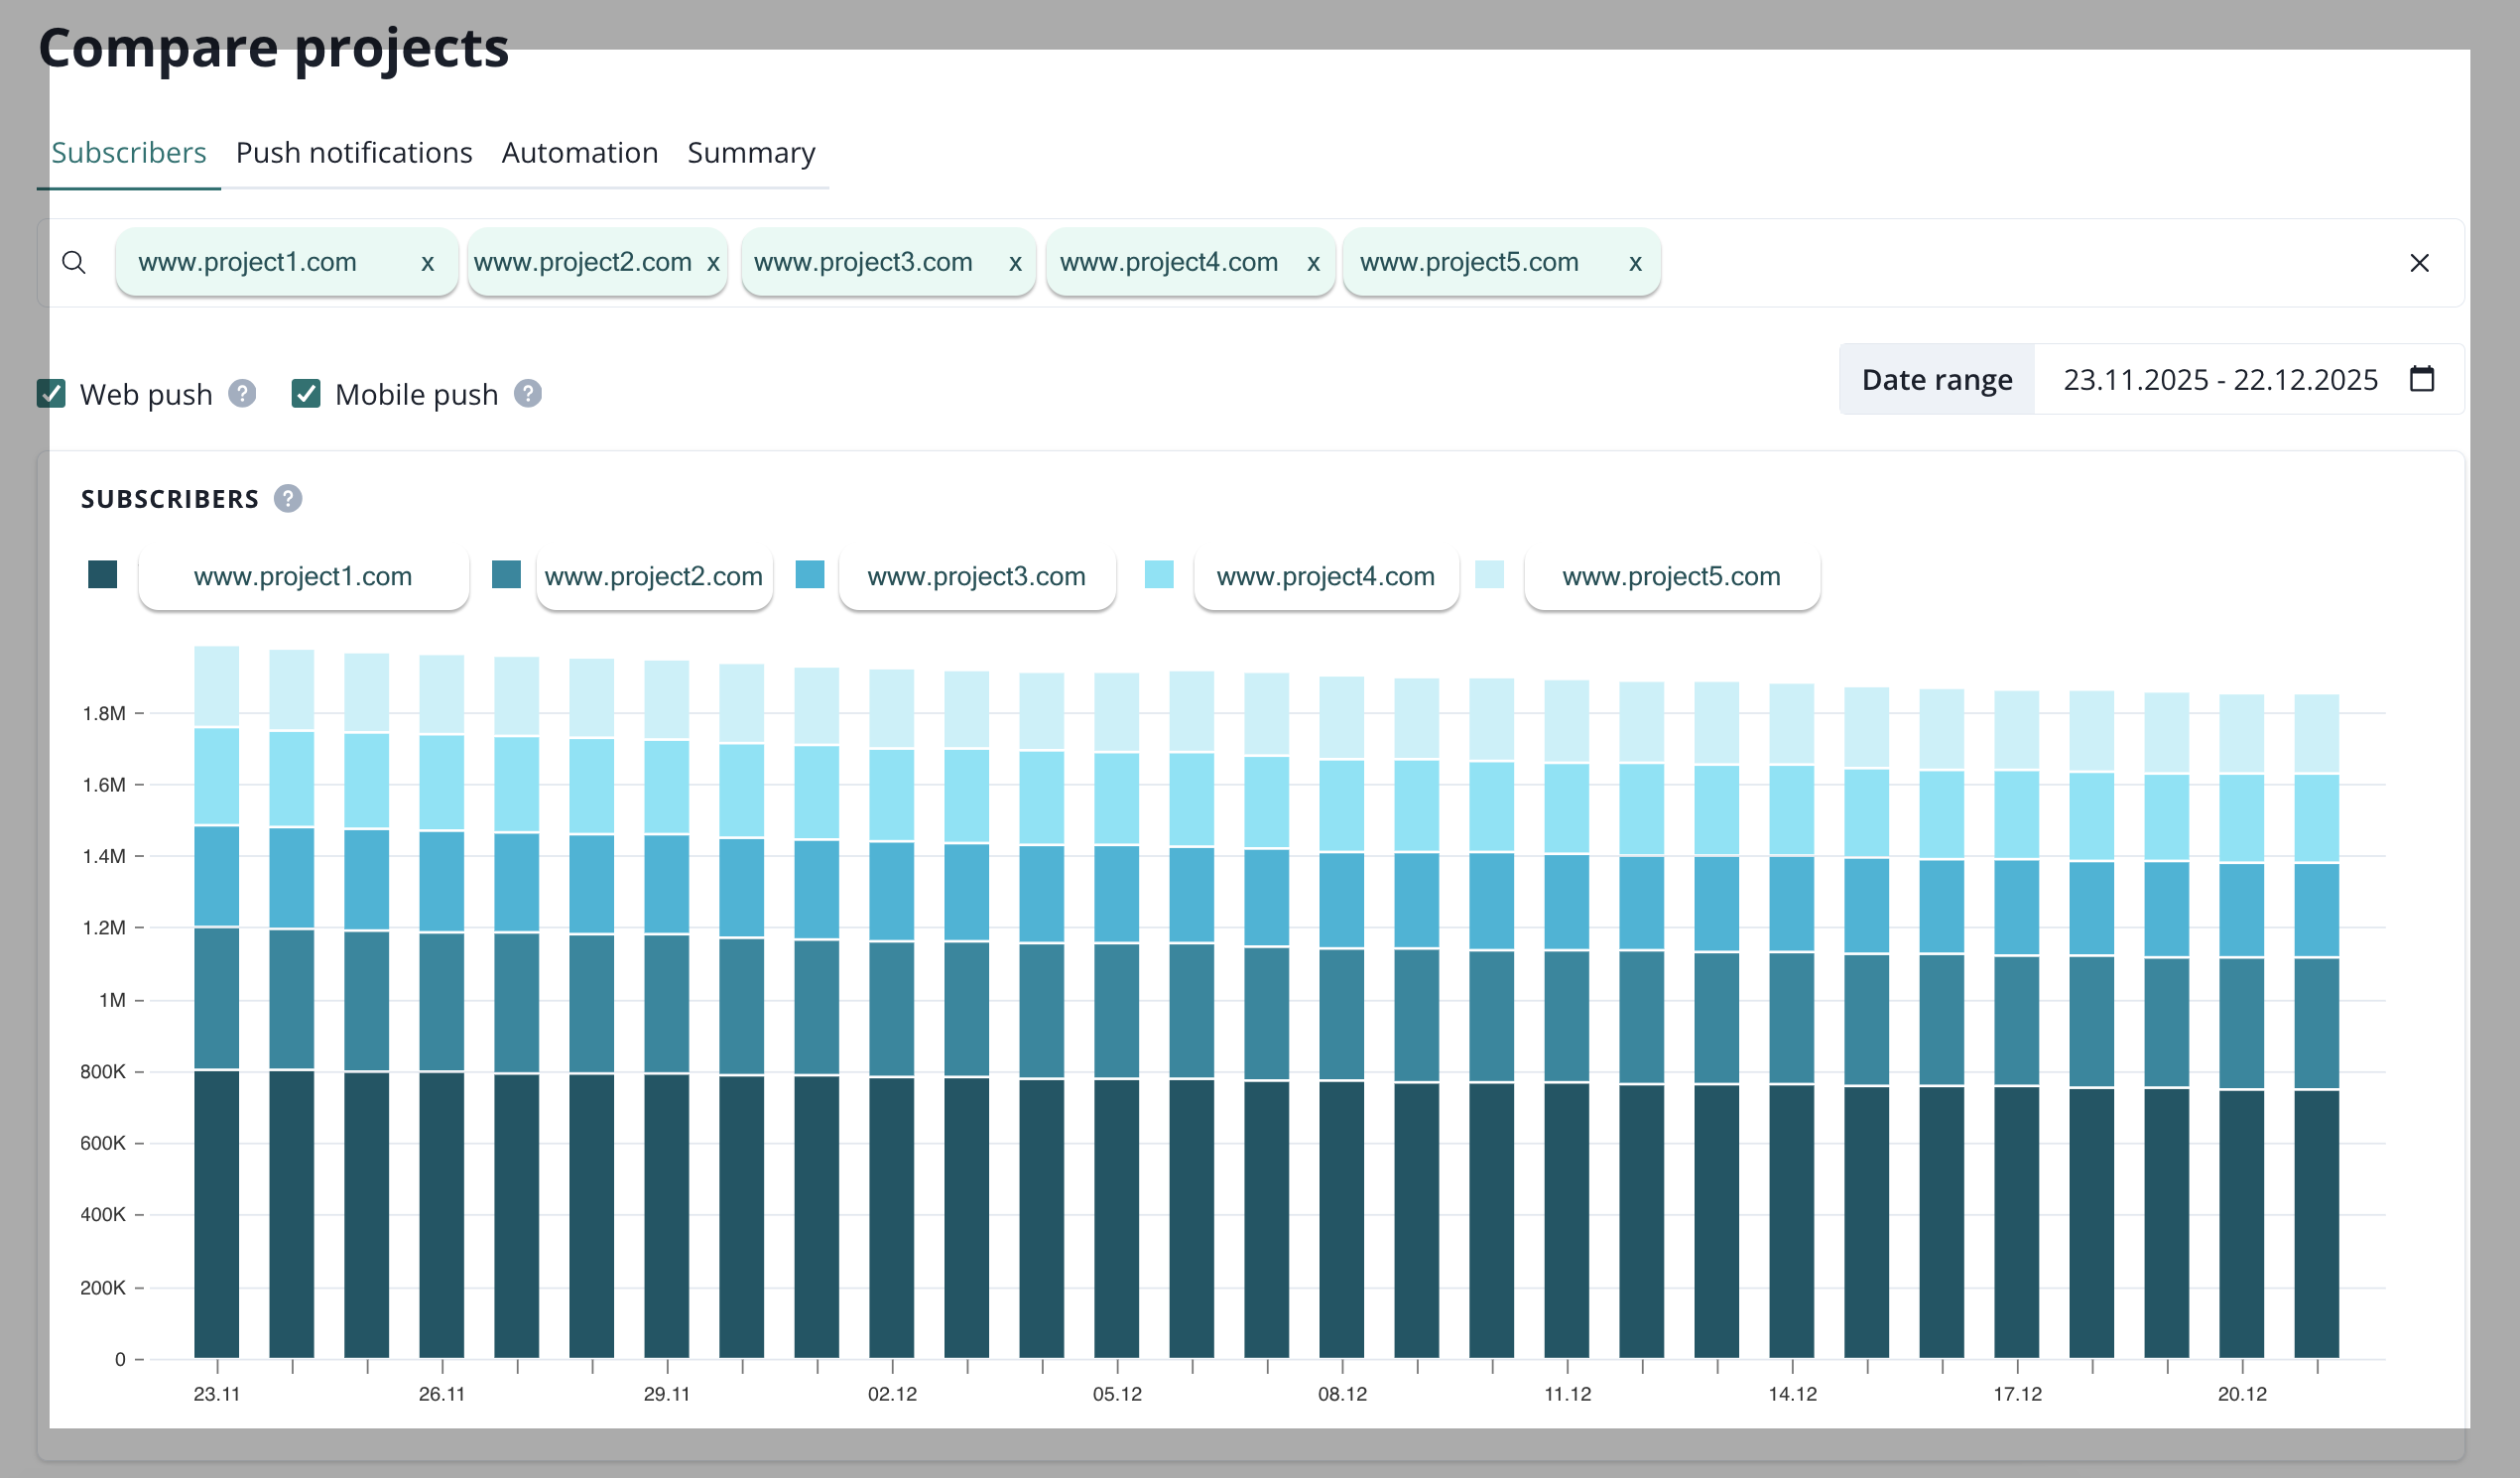
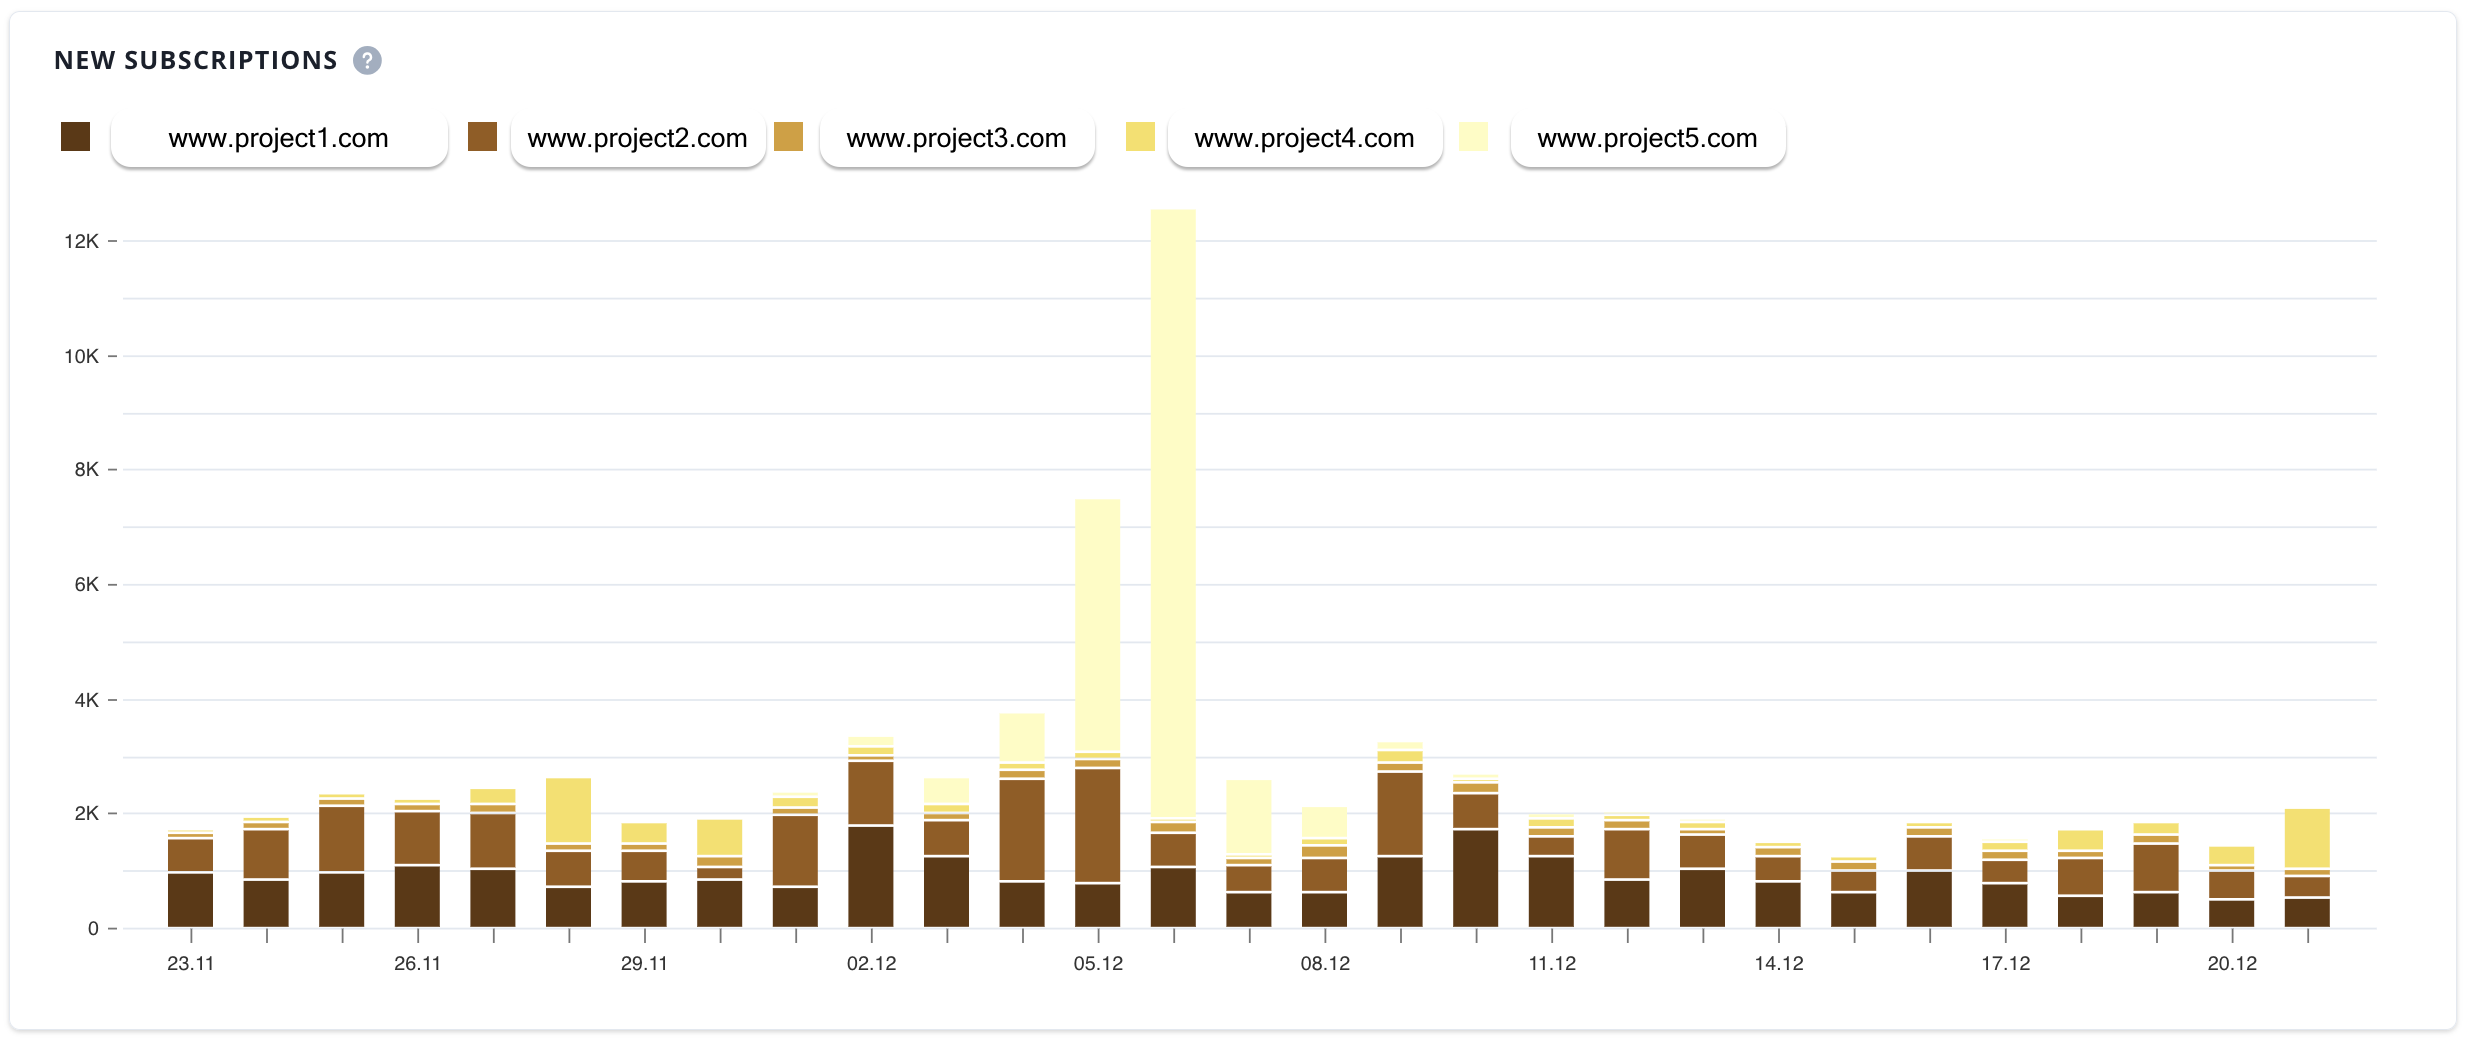
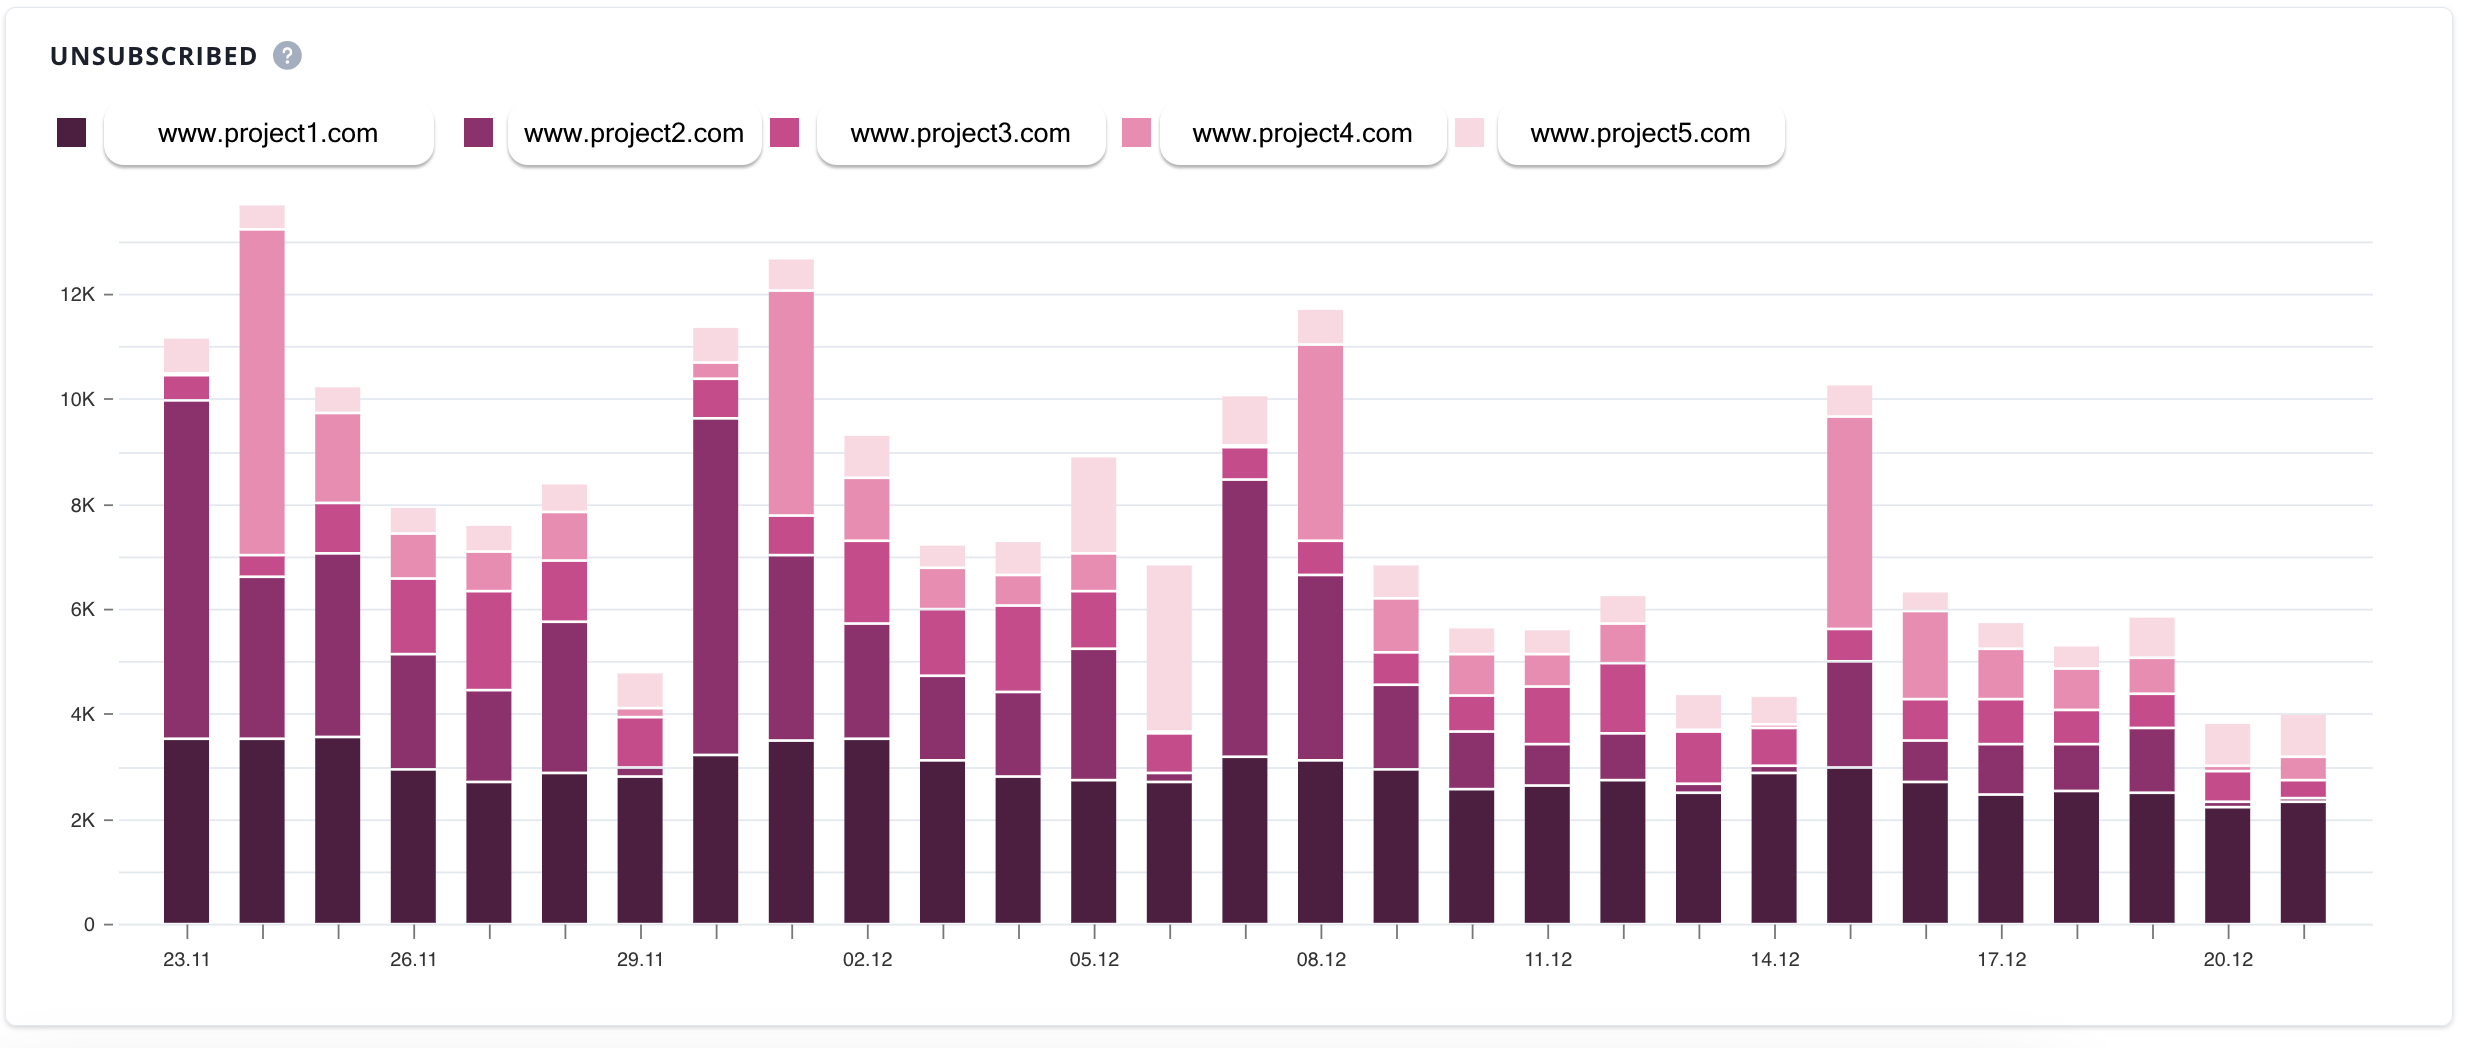
Numbers that you can consult here are: subscribers, new subscriptions, unsubscriptions.
Push notifications
Automations
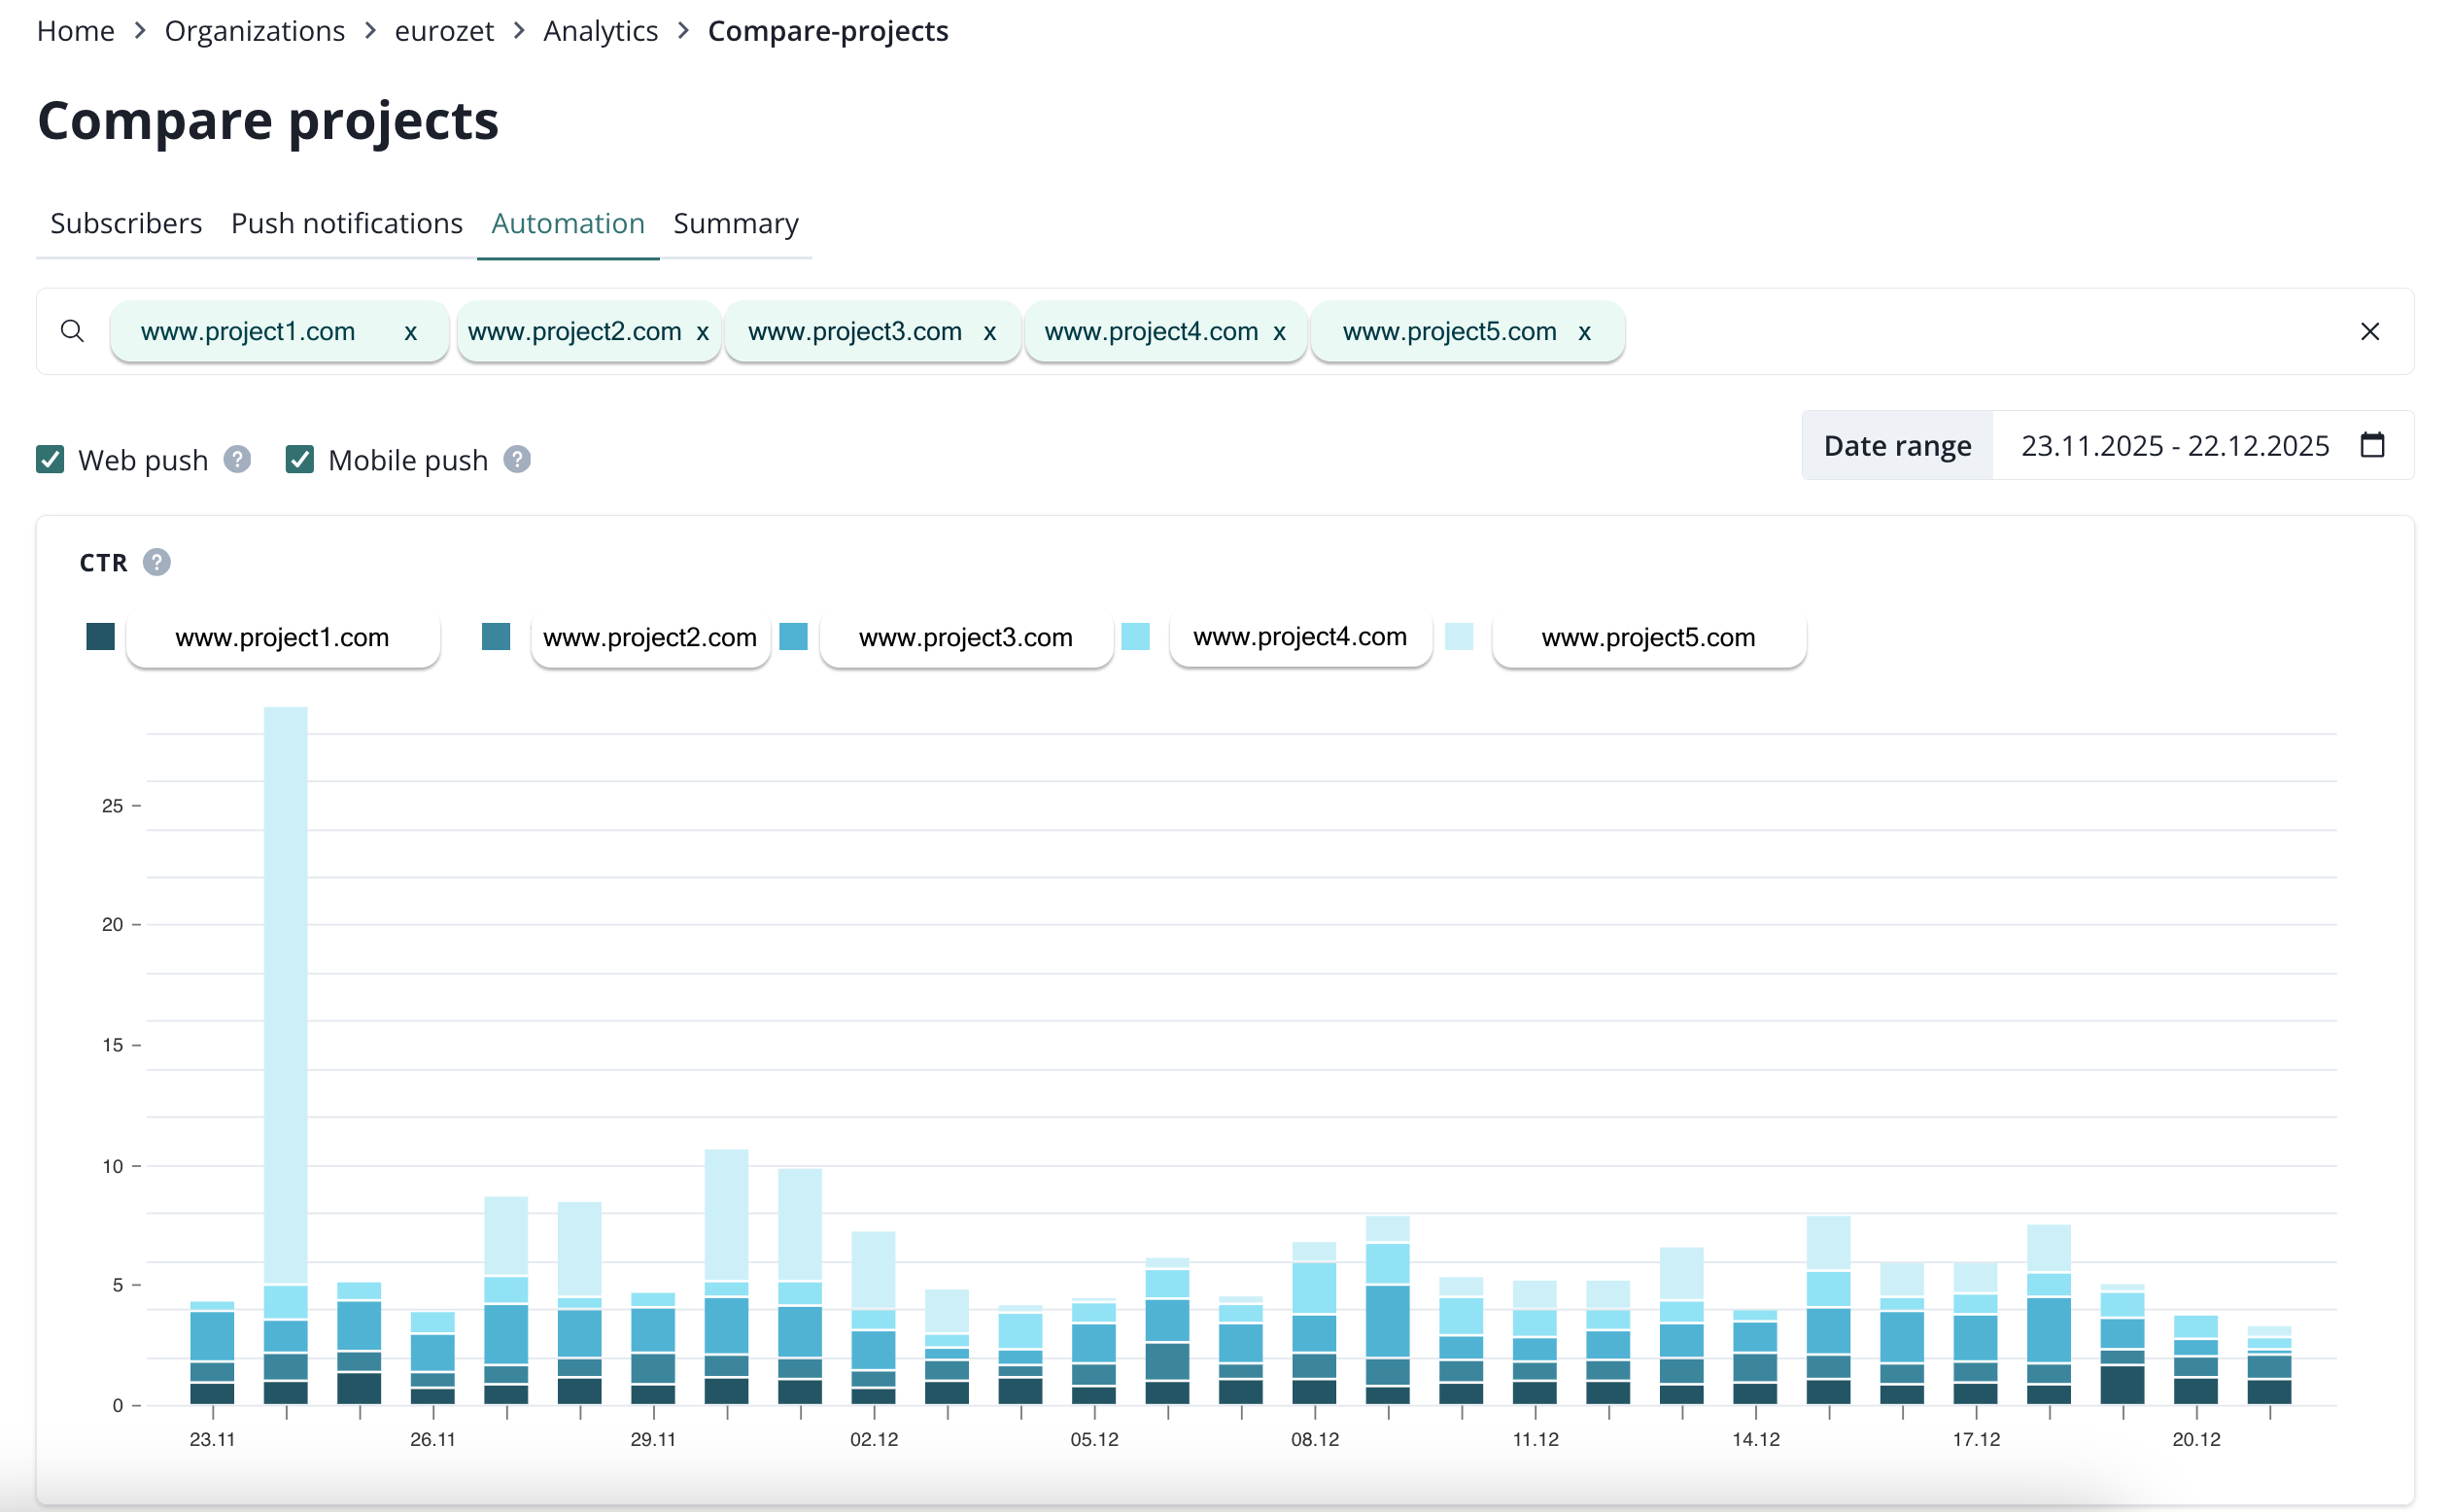
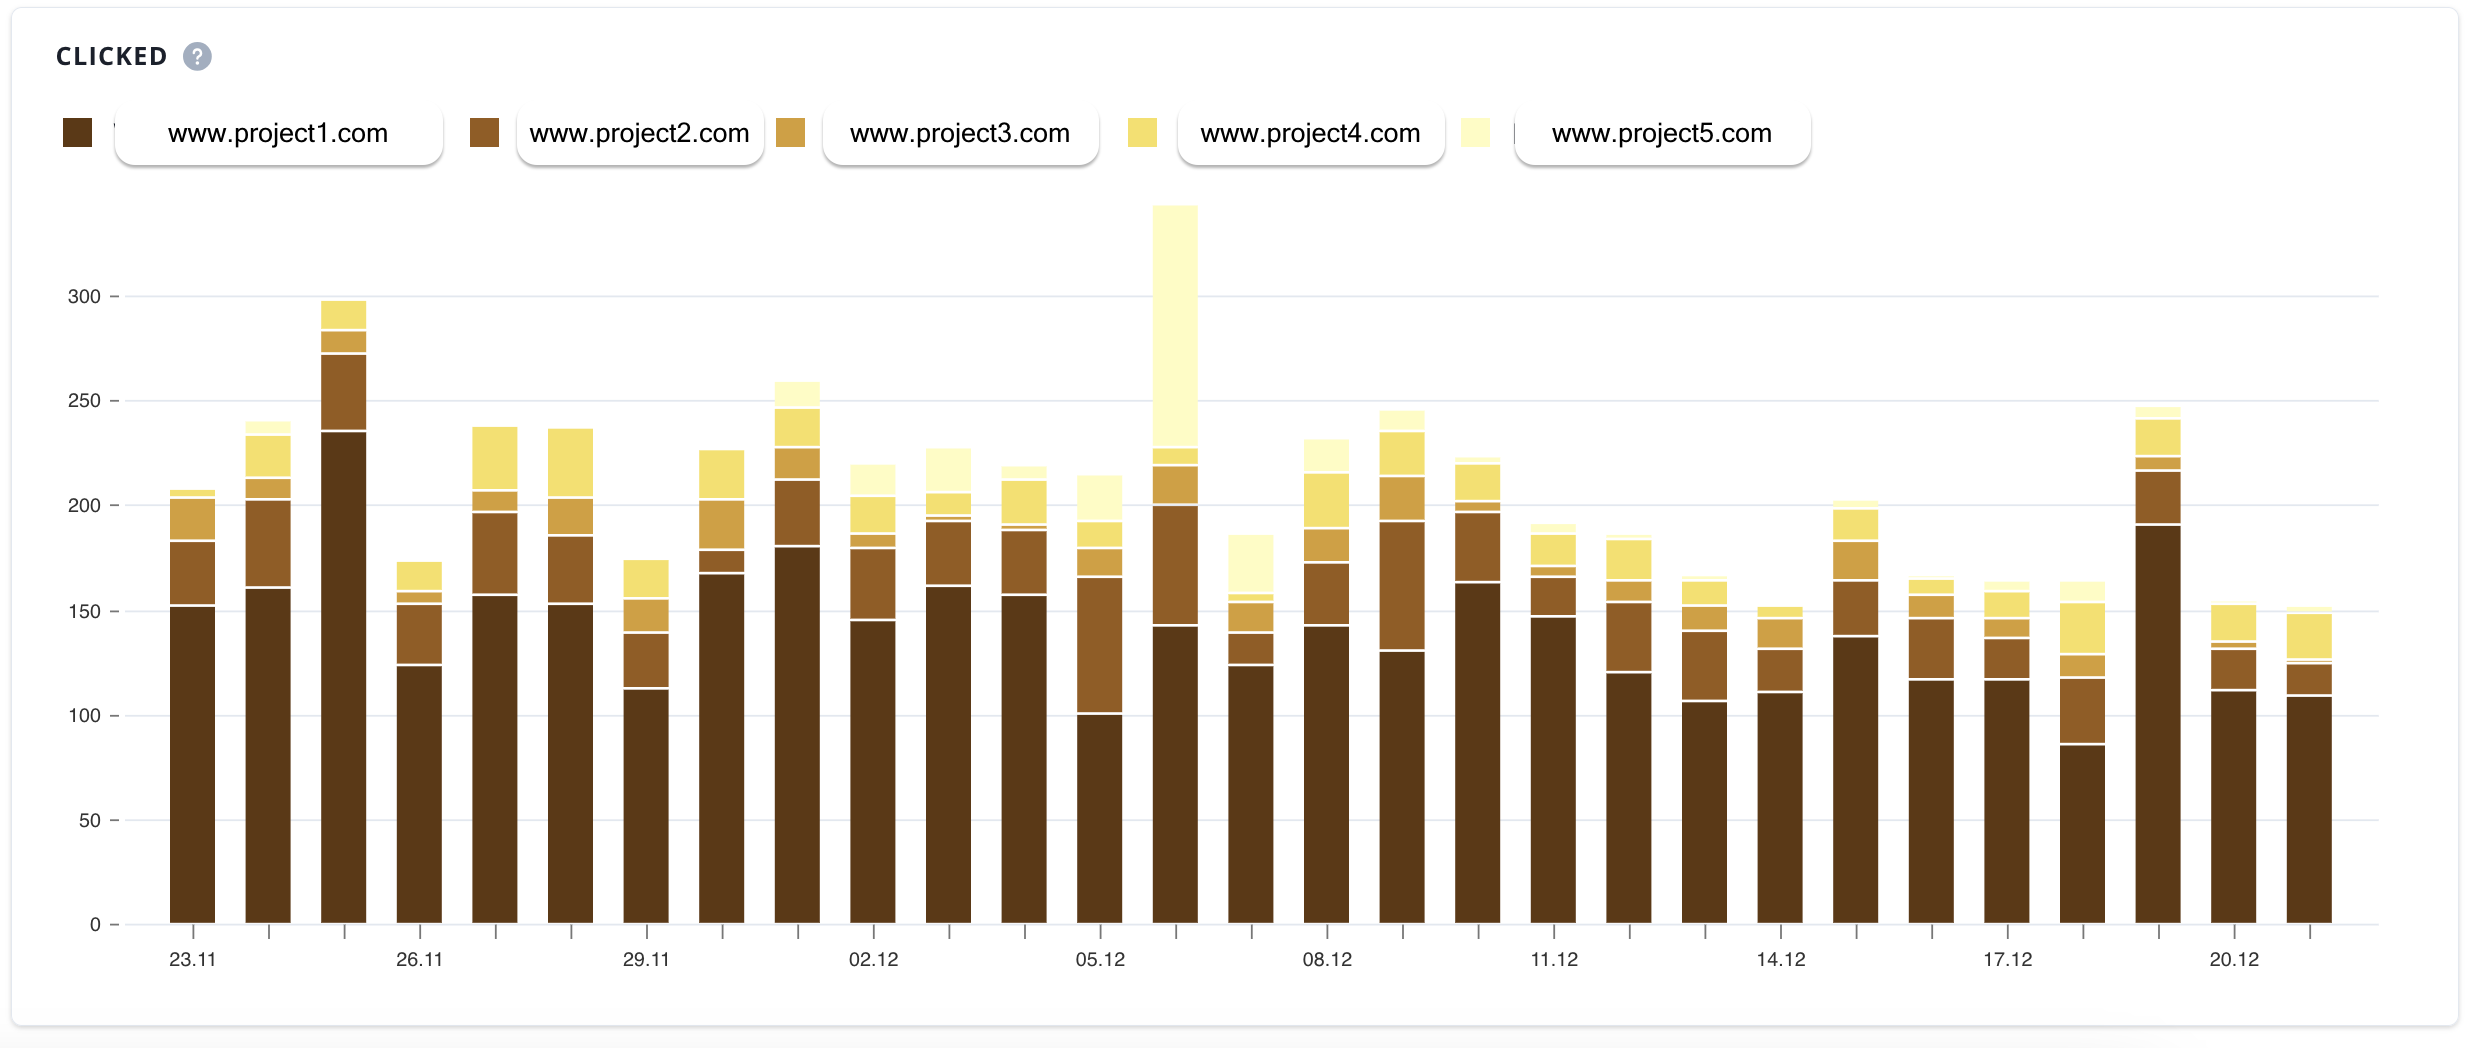
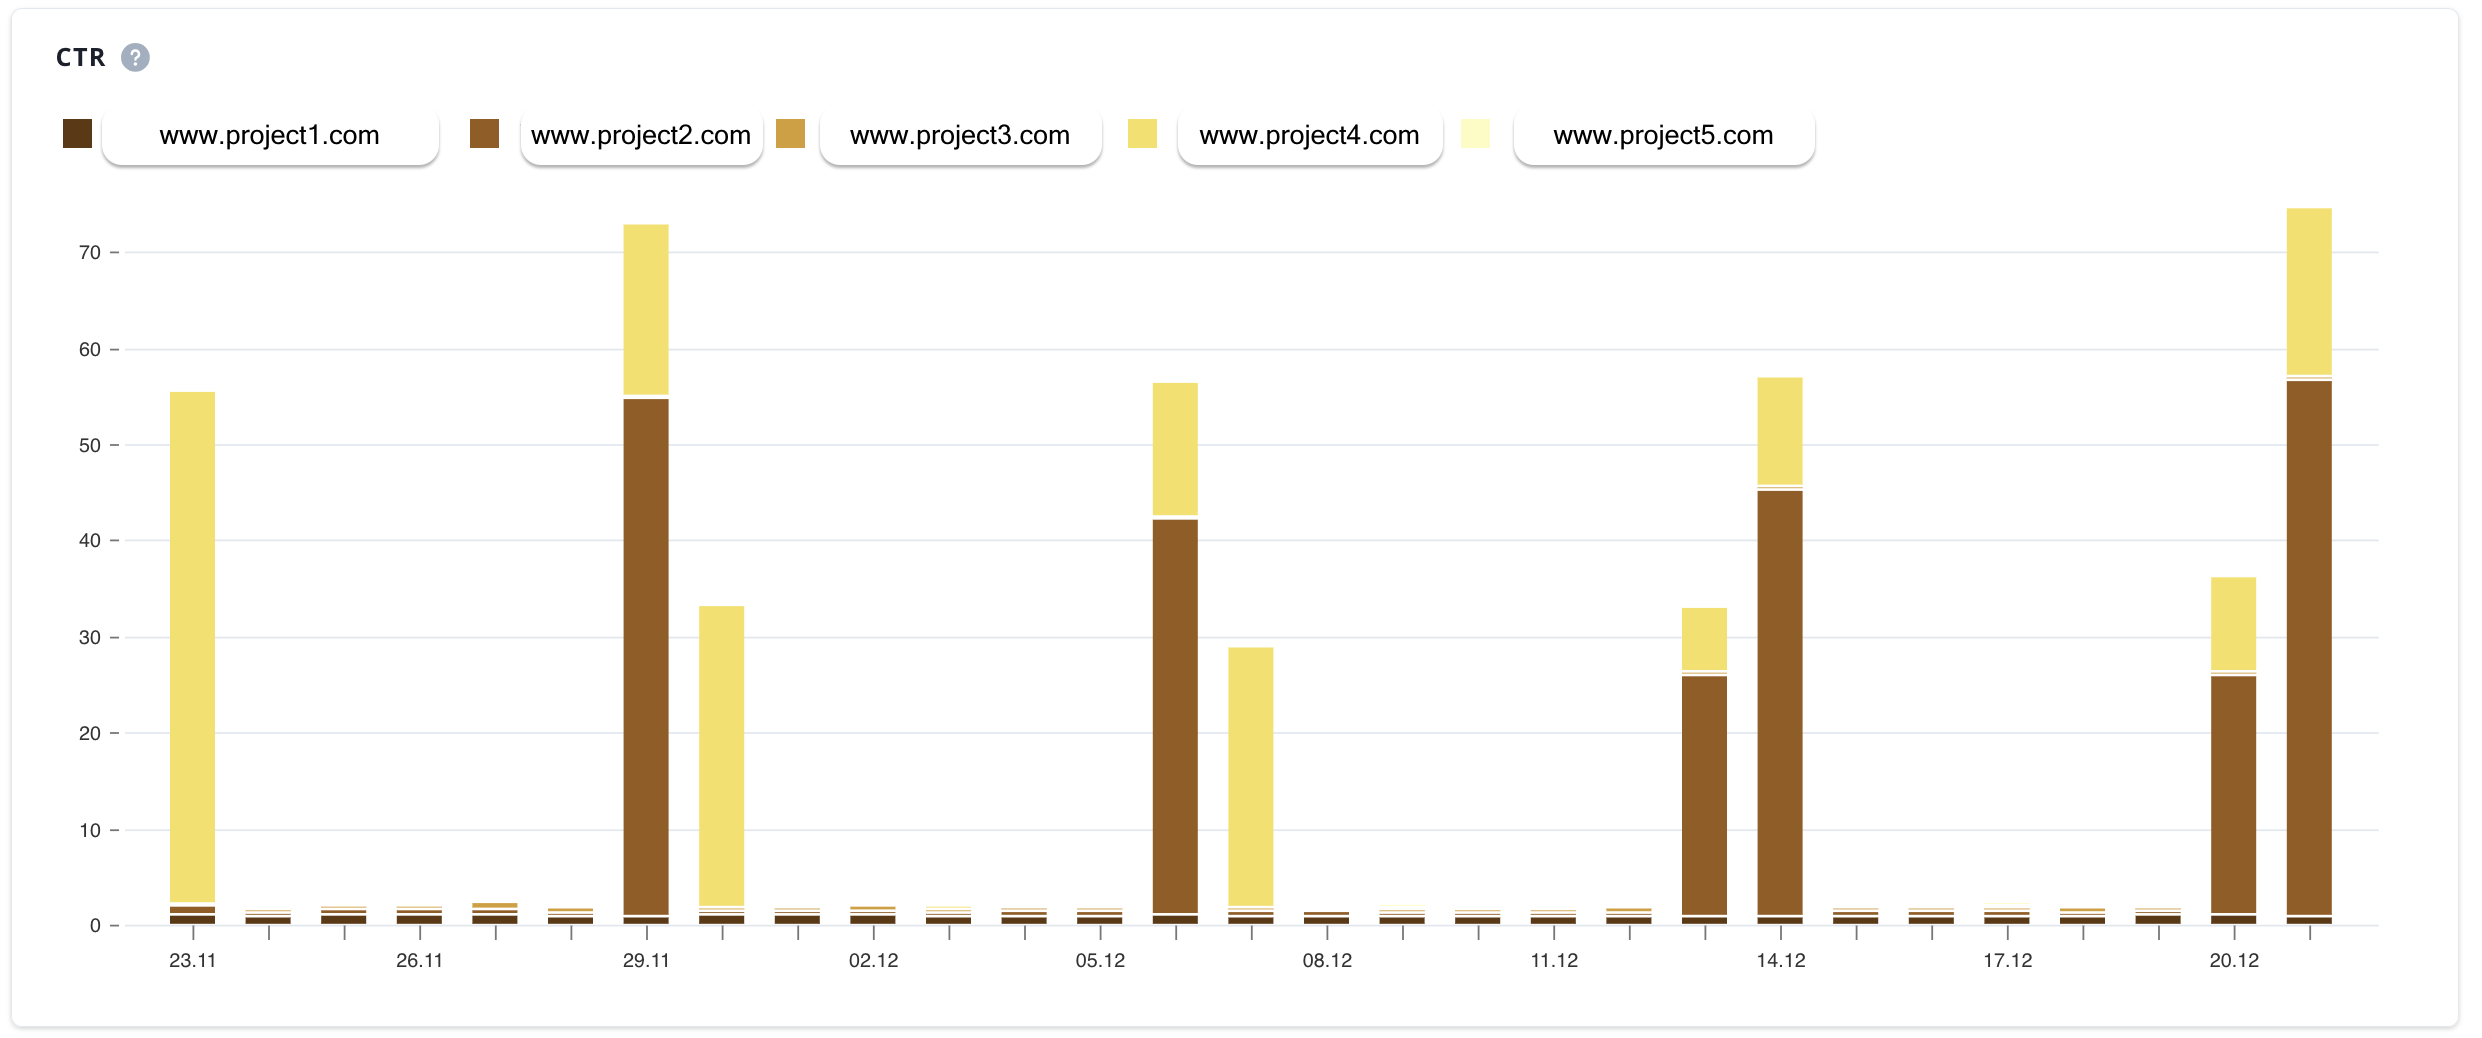
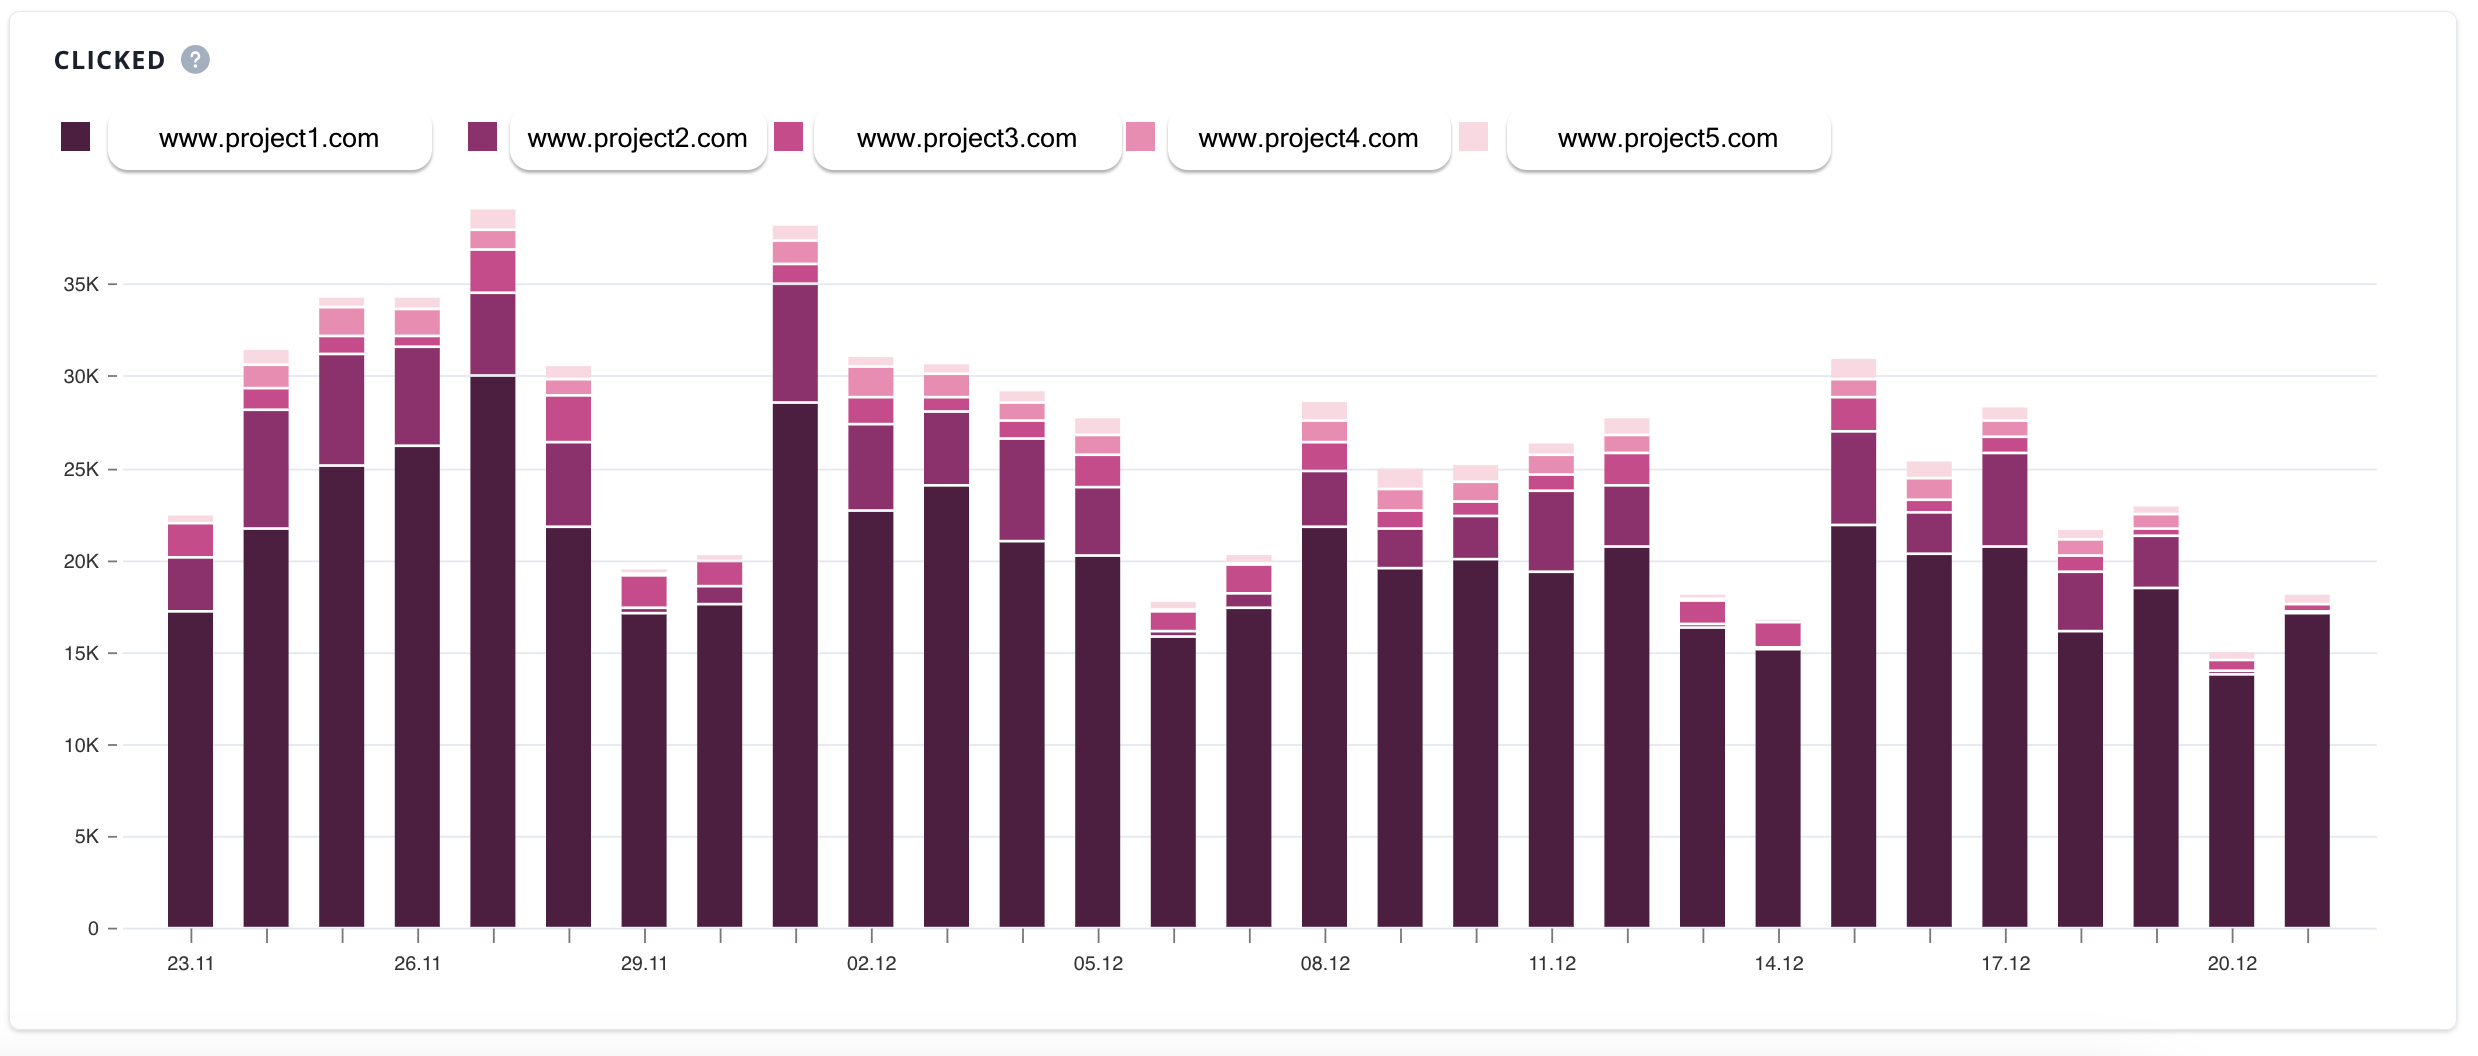
Numbers that you can consult here are: CTR, clicks.
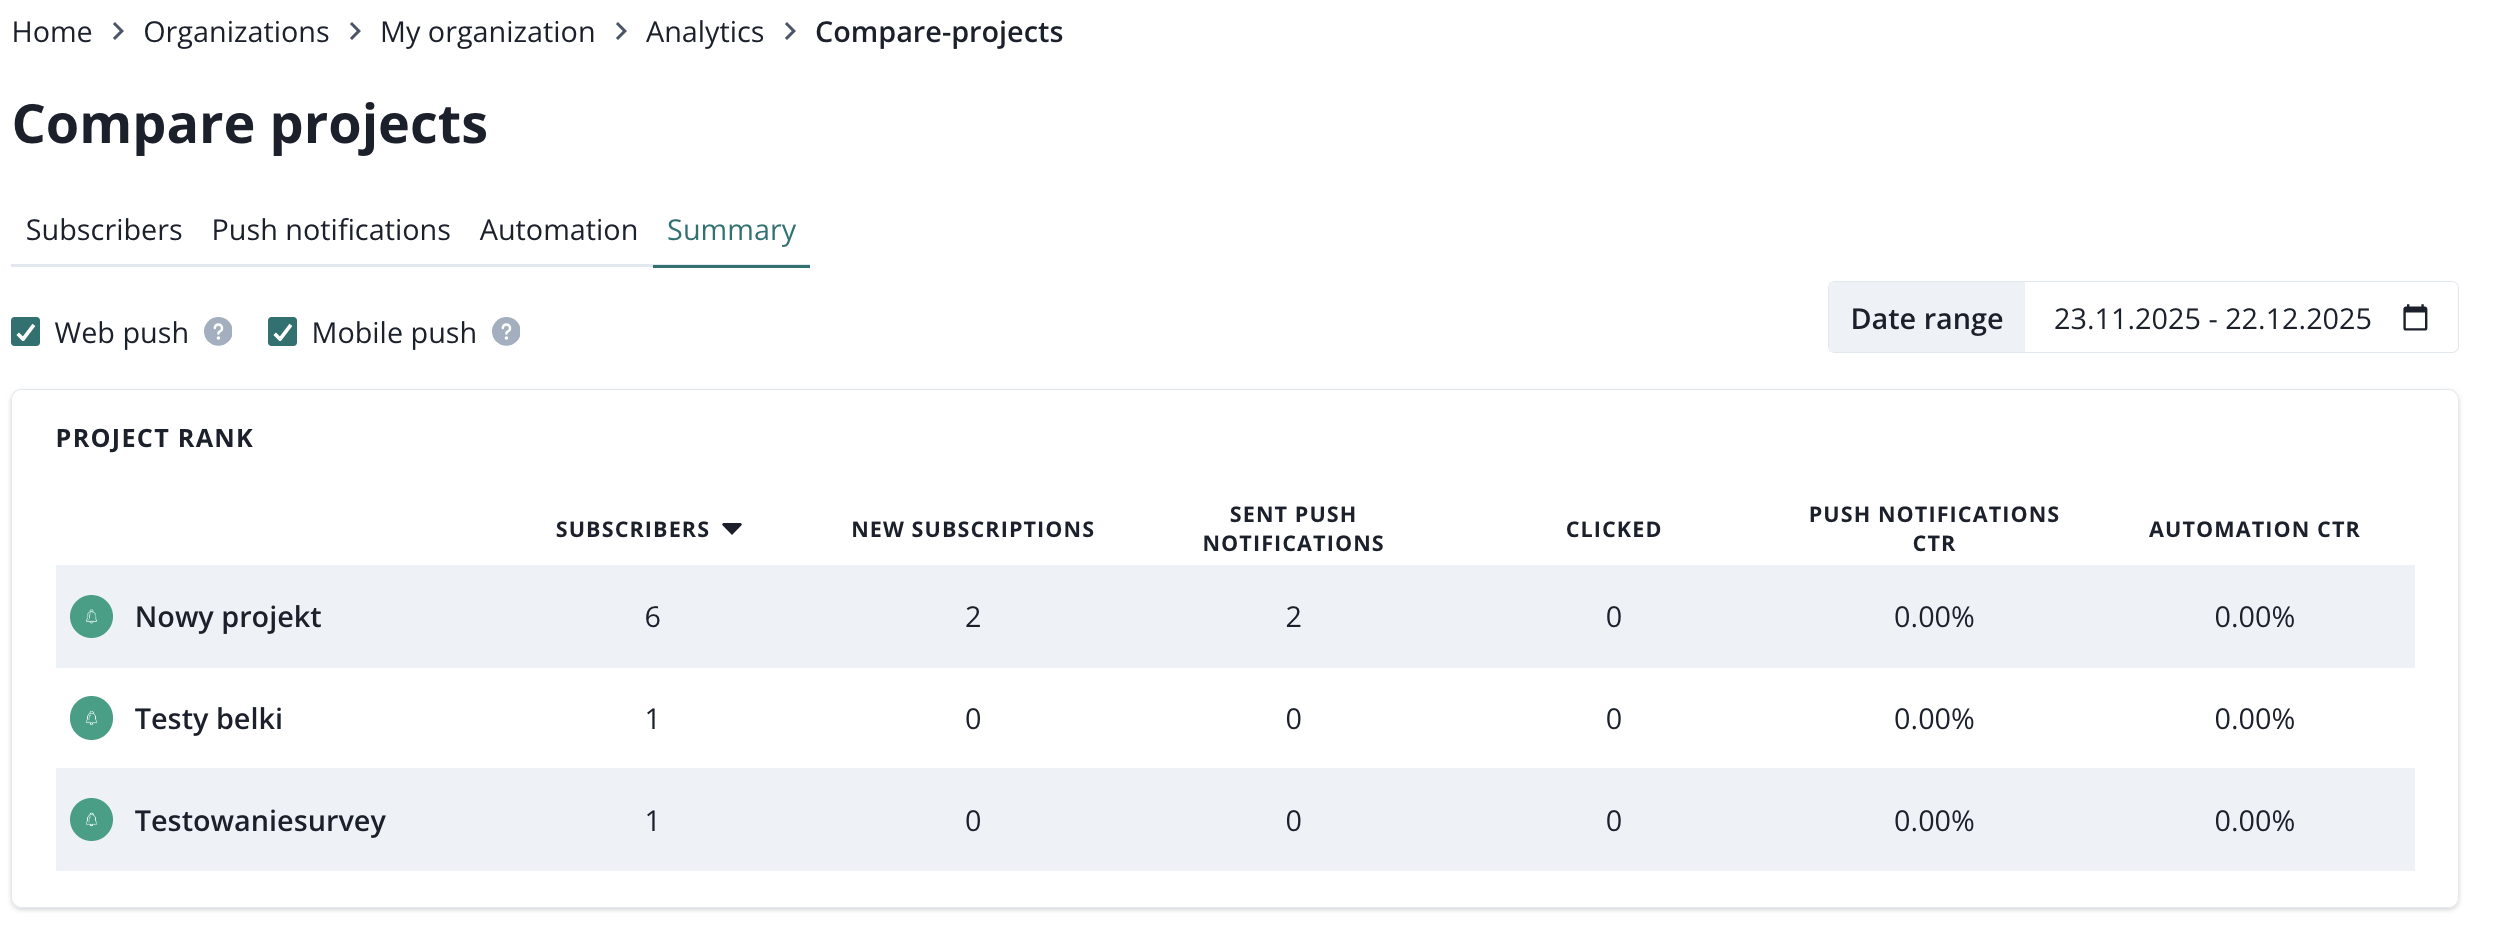
Summary
Here you will find a table with a maximum of 10 projects' numbers. The table can be ordered by any column, so it will always display 10 projects ranked from either the highest to the lowest score.